
Detecting Vulnerable-Docker-Engine
Team:
- Khasan Abdurakhmanov
- Mbachan Fabrice
- Ahmed Saad
- Vanel Nara
Introduction
In the modern landscape of containerized applications, Docker has become a key technology for deploying scalable and portable environments. However, with the increased usage of Docker, the threat landscape has also expanded, making Docker containers an attractive target for cyber attackers. Vulnerabilities within containers can lead to severe breaches, data theft, and system compromises. Therefore, it is crucial to implement robust security measures to monitor and protect these environments.
Wazuh, an open-source security monitoring platform, provides comprehensive capabilities to detect and respond to security incidents in Docker environments. By leveraging Wazuh's powerful detection engine, custom rules, and real-time monitoring, organizations can significantly enhance their ability to identify and prevent attacks targeting vulnerable Docker containers.


This guide will walk you through configuring Wazuh to detect attacks exploiting vulnerabilities in the Docker engine. We will cover the necessary steps to set up the Docker Listener module, create custom decoders and rules, and analyze the relevant logs to identify potential attacks. By following these best practices, you can strengthen the security of your Docker infrastructure and minimize the risk of successful exploits.
1. Tools and Setup
Before diving into the specifics of configuring Wazuh for monitoring Docker containers, it's essential to have a clear understanding of the tools involved and their setup. This section will cover the installation and basic setup of the Docker engine, deploying a vulnerable container, and providing an in-depth explanation of the Wazuh architecture.
1.1 Vulnerable Docker Engine
In this guide, we will be using a deliberately vulnerable Docker container to demonstrate the detection capabilities of Wazuh.

This project is designed as a vulnerable Docker engine for educational purposes. Its primary goal is to showcase vulnerabilities that frequently pose risks in the digital world.
CVE-2021-41091 is a flaw in Moby (Docker Engine) that allows unprivileged Linux users to traverse and execute programs within the data directory (usually located at /var/lib/docker) due to improperly restricted permissions. This vulnerability is present when containers contain executable programs with extended permissions, such as setuid. Unprivileged Linux users can discover and execute those programs, as well as modify files if the UID of the user on the host matches the file owner or group inside the container.
By providing a real-life simulation of this vulnerability, this project serves as an invaluable learning tool for a diverse range of individuals. To set up the vulnerable Docker Engine, simply install the specific version of Docker 20.10.5. All the deb files for Debian distribution are available in the repository.
1.3 Wazuh - The Open Source Security Platform
Wazuh is a free and open source platform used for threat prevention, detection, and response. It is capable of protecting workloads across on-premises, virtualized, containerized, and cloud-based environments.
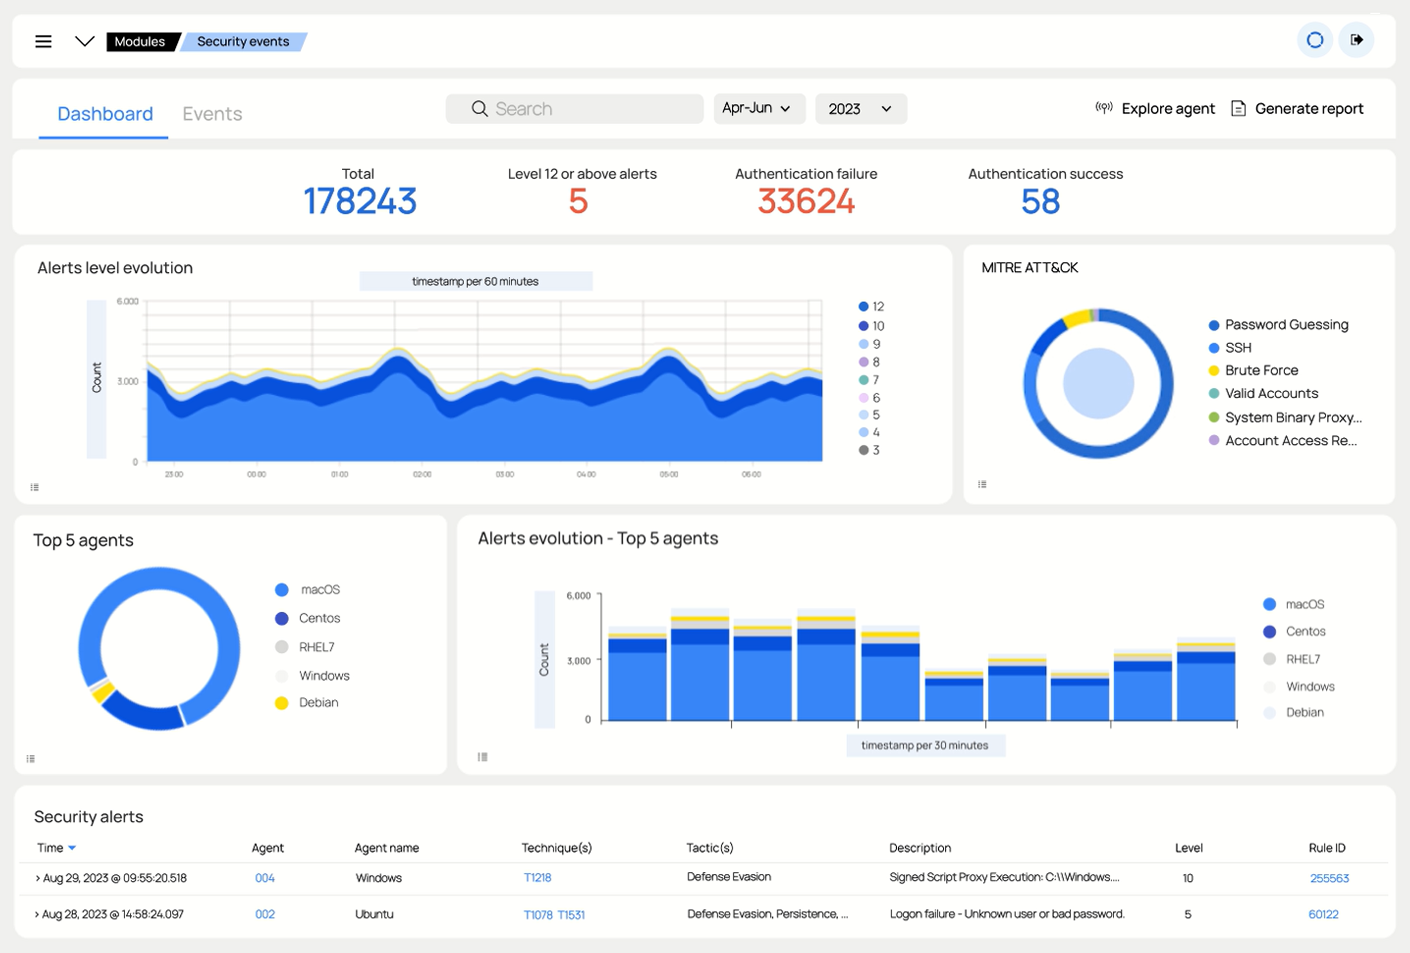
Wazuh solution consists of an endpoint security agent, deployed to the monitored systems, and a management server, which collects and analyzes data gathered by the agents. Besides, Wazuh has been fully integrated with the Elastic Stack, providing a search engine and data visualization tool that allows users to navigate through their security alerts.
1.3.1 Architecture
The Wazuh architecture uses agents on monitored endpoints to forward security data to a central server. Agentless devices like firewalls, switches, routers, and access points can send log data via Syslog, SSH, or API. The server decodes and analyzes this information, then sends it to the Wazuh indexer for indexing and storage.
A Wazuh indexer cluster can have one or more nodes for read and write operations. Small deployments can use a single-node cluster, while multi-node clusters are better for large data volumes or high availability.
For production, it's recommended to deploy the Wazuh server and indexer on different hosts. Filebeat securely forwards Wazuh alerts and events to the indexer cluster using TLS encryption.
The diagram below shows a Wazuh deployment architecture, illustrating the components and how the server and indexer nodes can be configured as clusters for load balancing and high availability.
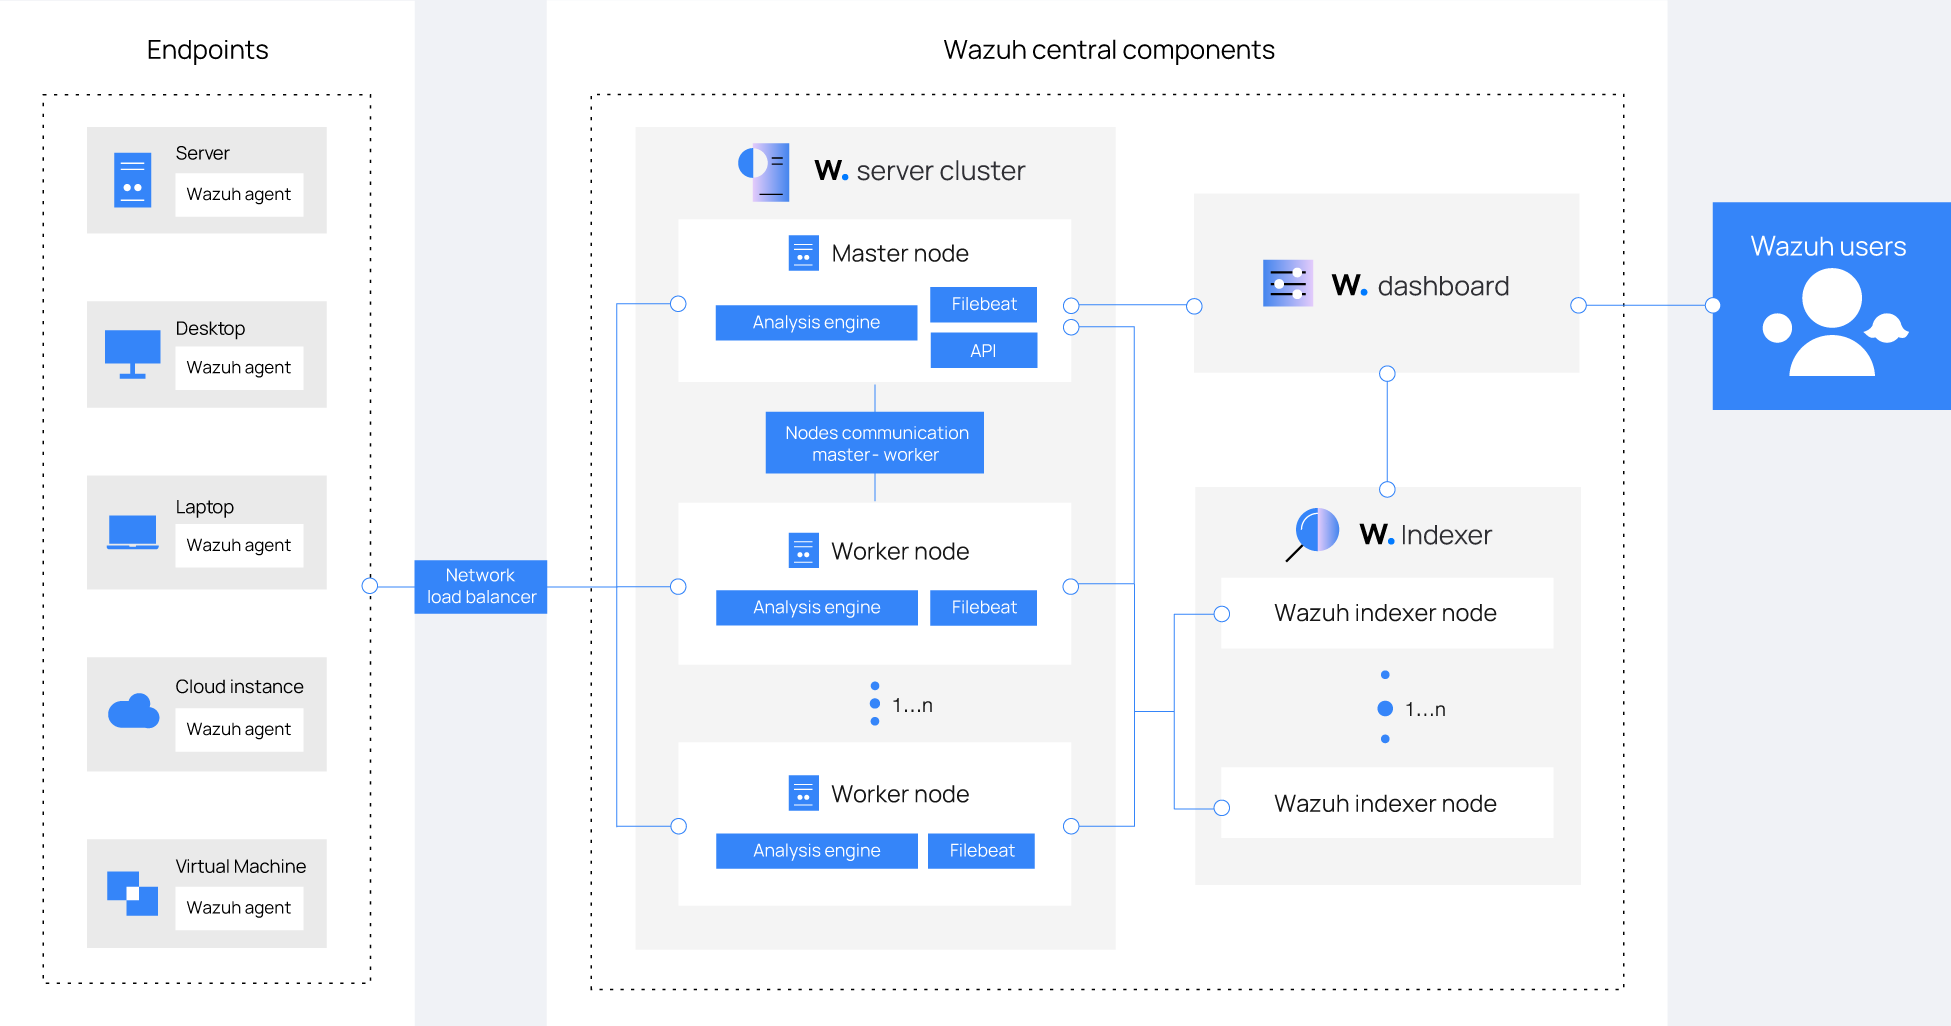
The Wazuh agent sends events to the Wazuh server for analysis and threat detection. The agent connects to the server on port 1514 (default, configurable). The server decodes and checks events, adding alert data if a rule is triggered. Events are saved to:
/var/ossec/logs/archives/archives.json(all events)
/var/ossec/logs/alerts/alerts.json(events triggering high-priority rules, configurable)
Wazuh uses AES encryption (128-bit blocks, 256-bit keys) by default, with optional Blowfish encryption.
The Wazuh server uses Filebeat to send alert and event data to the Wazuh indexer with TLS encryption. Filebeat reads the server output and sends it to the indexer (default port 9200/TCP). The indexed data is then visualized using the Wazuh dashboard. The Wazuh dashboard queries the Wazuh RESTful API (default port 55000/TCP) to display configuration and status information of the Wazuh server and agents. It can also modify settings through API calls, with communication encrypted and authenticated by username and password.
1.4 Deployment Methods
There are three methods to deploy Wazuh:
- Wazuh via Docker: Deploy Wazuh components as Docker containers.
- Building Docker images for the Wazuh manager, indexer, and dashboard components
- Configuring a multi-node Wazuh deployment using Docker Compose
- Generating SSL/TLS certificates for secure communication between the Wazuh components
- Wazuh Manual Installation: Install Wazuh components directly on the host operating system.
- Installing the Wazuh central components (server, indexer, and dashboard) on one or more hosts
- Deploying the Wazuh agent on the endpoints to be monitored
- Configuring the Wazuh components and integrating them into the infrastructure
- Wazuh Cloud: Use the Wazuh Cloud service for a managed deployment.
- Wazuh Cloud hosts and manages all the Wazuh components in a single integrated platform
- It handles the installation, scaling, and updates of the Wazuh components
- Wazuh Cloud provides a free trial to create and explore the cloud environment
- It offers predefined environment profiles (Small, Medium, Large) to cater to different needs
In summary, you can choose from these three options to set up Wazuh based on your specific requirements, infrastructure, and resource constraints.
1.4.1 Wazuh Docker deployment
You can deploy Wazuh as a single-node or multi-node stack.
- Single-node deployment: Deploys one Wazuh manager, indexer, and dashboard node.
- Multi-node deployment: Deploys two Wazuh manager nodes (one master and one worker), three Wazuh indexer nodes, and a Wazuh dashboard node.
Both deployments use persistence and allow configuring certificates to secure communications between nodes. The multi-node stack is the only deployment that contains high availability.
In our case we will only consider Single-node deployment:
- Clone the Wazuh repository to your system:
git clone https://github.com/wazuh/wazuh-docker.git -b v4.3.0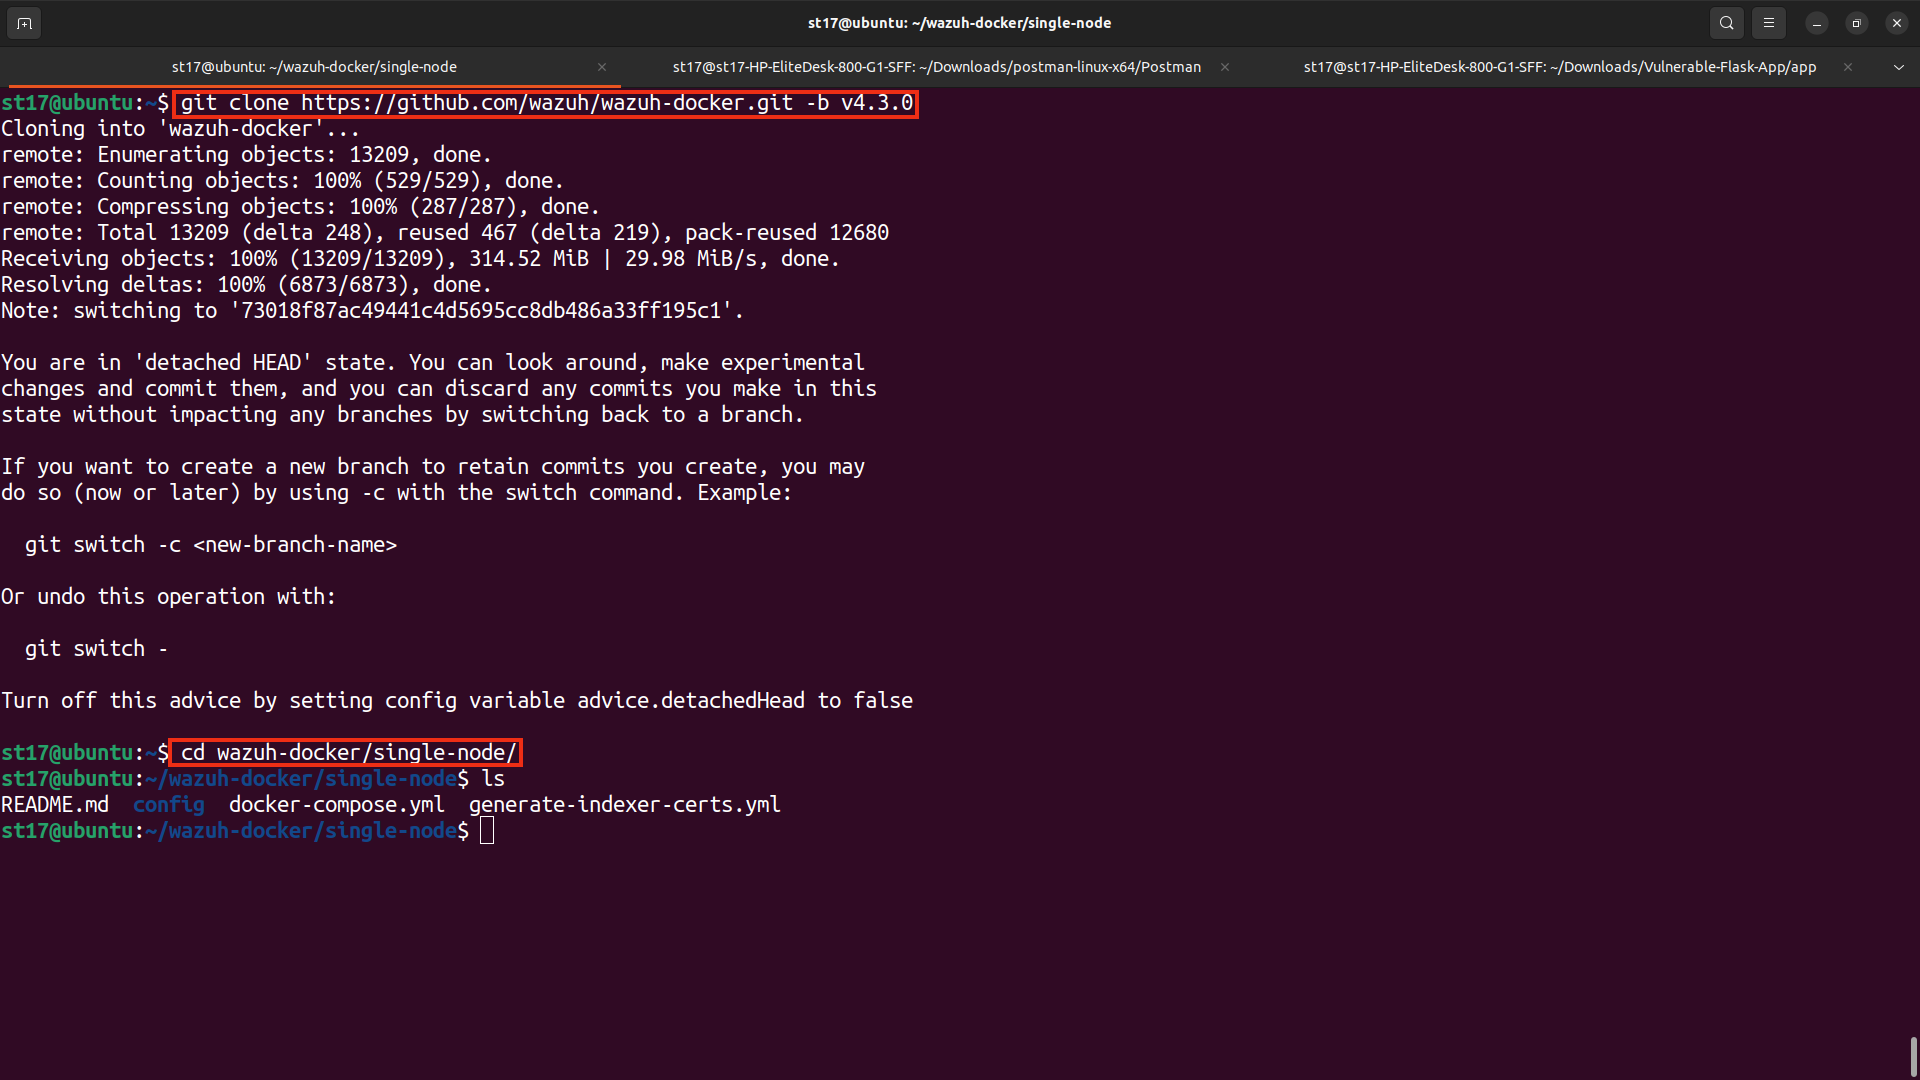
Provide a group of certificates for each node in the stack to secure communication between the nodes. You have two alternatives to provide these certificates:
- Generate self-signed certificates for each cluster node
- We have created a Docker image to automate certificate generation using the Wazuh certs gen tool.
- If your system uses a proxy, add the following to the
generate-indexer-certs.ymlfile. If not, skip this particular step:environment: - HTTP_PROXY=YOUR_PROXY_ADDRESS_OR_DNSA completed example looks like:
# Wazuh App Copyright (C) 2017 Wazuh Inc. (License GPLv2)
version: '3'

services:
  generator:
    image: wazuh/wazuh-certs-generator:0.0.2
    hostname: wazuh-certs-generator
    volumes:
      - ./config/wazuh_indexer_ssl_certs/:/certificates/
      - ./config/certs.yml:/config/certs.yml
    environment:
      - HTTP_PROXY=YOUR_PROXY_ADDRESS_OR_DNS
Execute the following command to get the desired certificates:
Docker Compose version 2:
docker-compose -f generate-indexer-certs.yml run --rm generatorDocker Compose version 3:
docker compose -f generate-indexer-certs.yml run --rm generator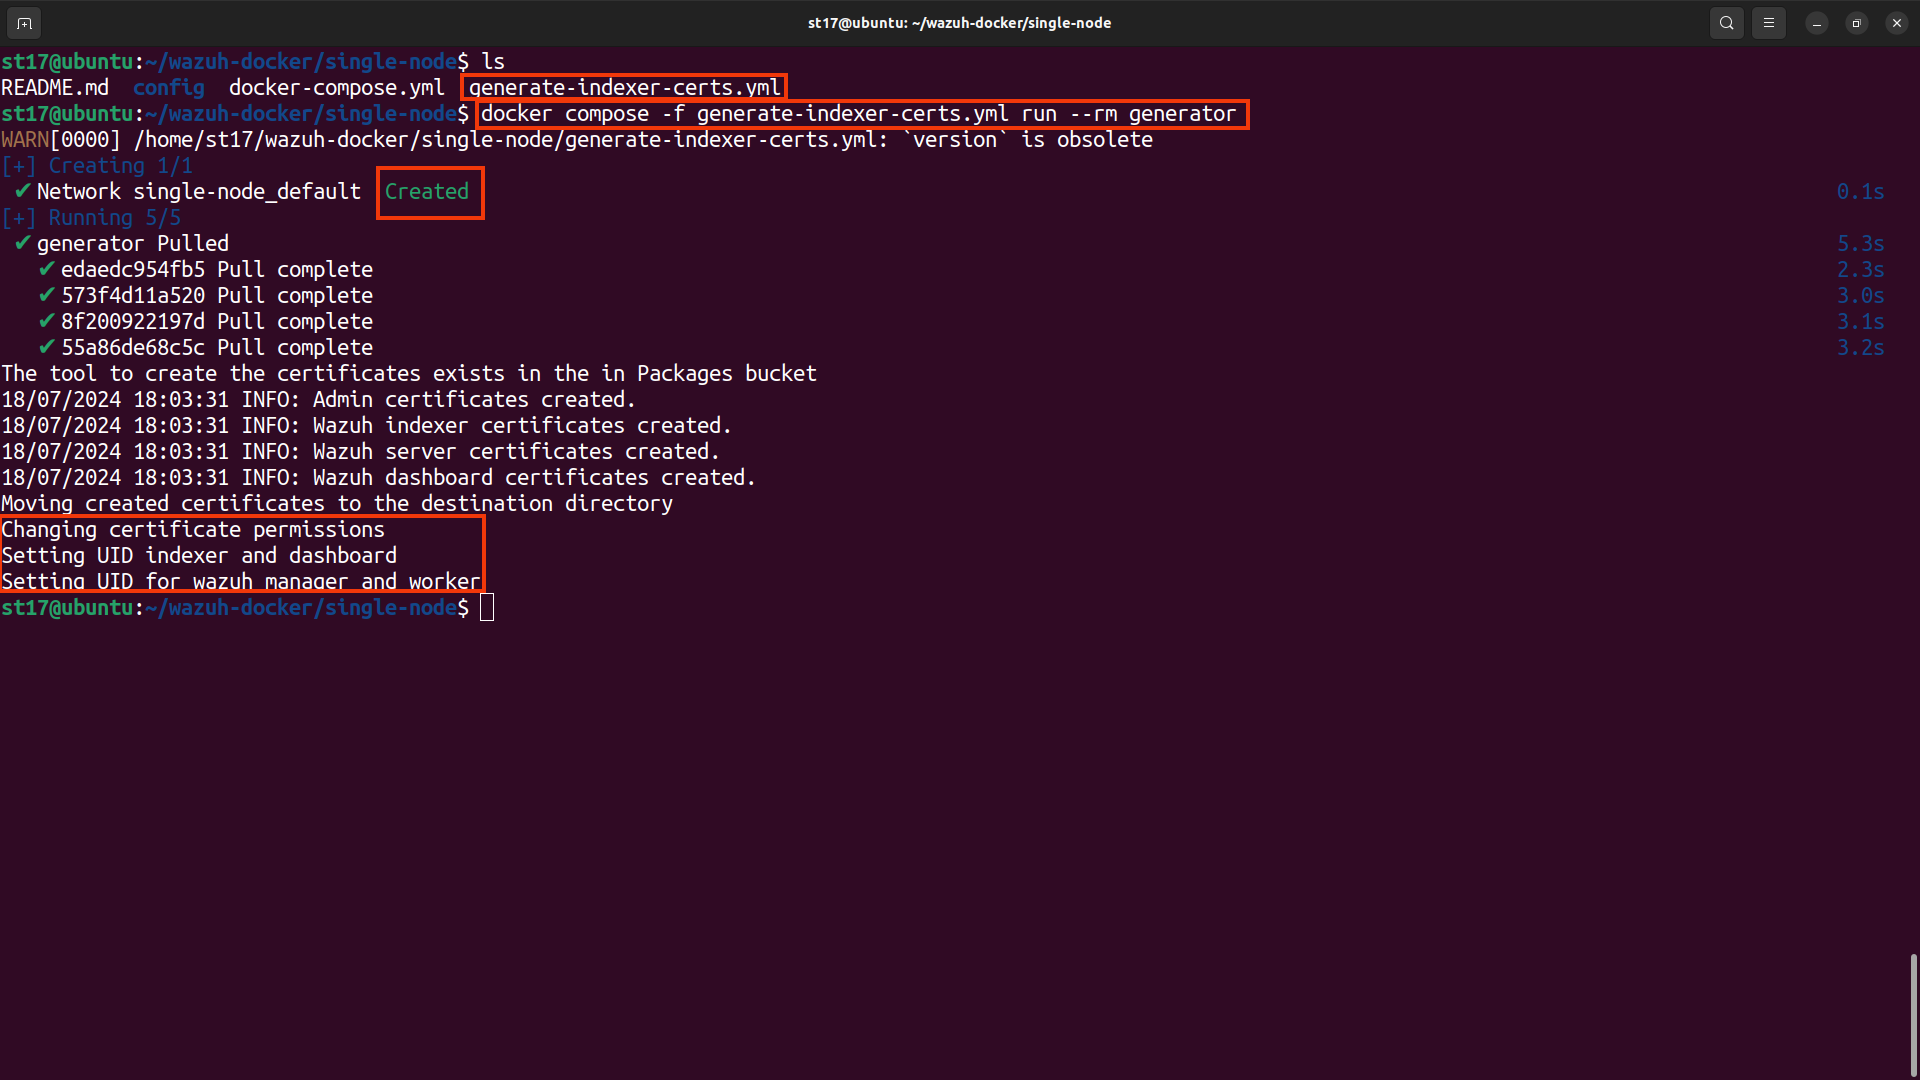
This saves the certificates into the config/wazuh_indexer_ssl_certs directory.
- Provide your own certificates for each node.
- In case you have your own certificates, provision them as follows in the
config/wazuh_indexer_ssl_certsdirectory:
Wazuh indexer:config/wazuh_indexer_ssl_certs/root-ca.pem config/wazuh_indexer_ssl_certs/wazuh.indexer-key.pem config/wazuh_indexer_ssl_certs/wazuh.indexer.pem config/wazuh_indexer_ssl_certs/admin.pem config/wazuh_indexer_ssl_certs/admin-key.pem
Wazuh manager:
config/wazuh_indexer_ssl_certs/root-ca-manager.pem
config/wazuh_indexer_ssl_certs/wazuh.manager.pem
config/wazuh_indexer_ssl_certs/wazuh.manager-key.pem
Wazuh dashboard:
config/wazuh_indexer_ssl_certs/wazuh.dashboard.pem config/wazuh_indexer_ssl_certs/wazuh.dashboard-key.pem config/wazuh_indexer_ssl_certs/root-ca.pem - In case you have your own certificates, provision them as follows in the
- Start the Wazuh single-node deployment using docker-compose:
Foreground:
docker-compose up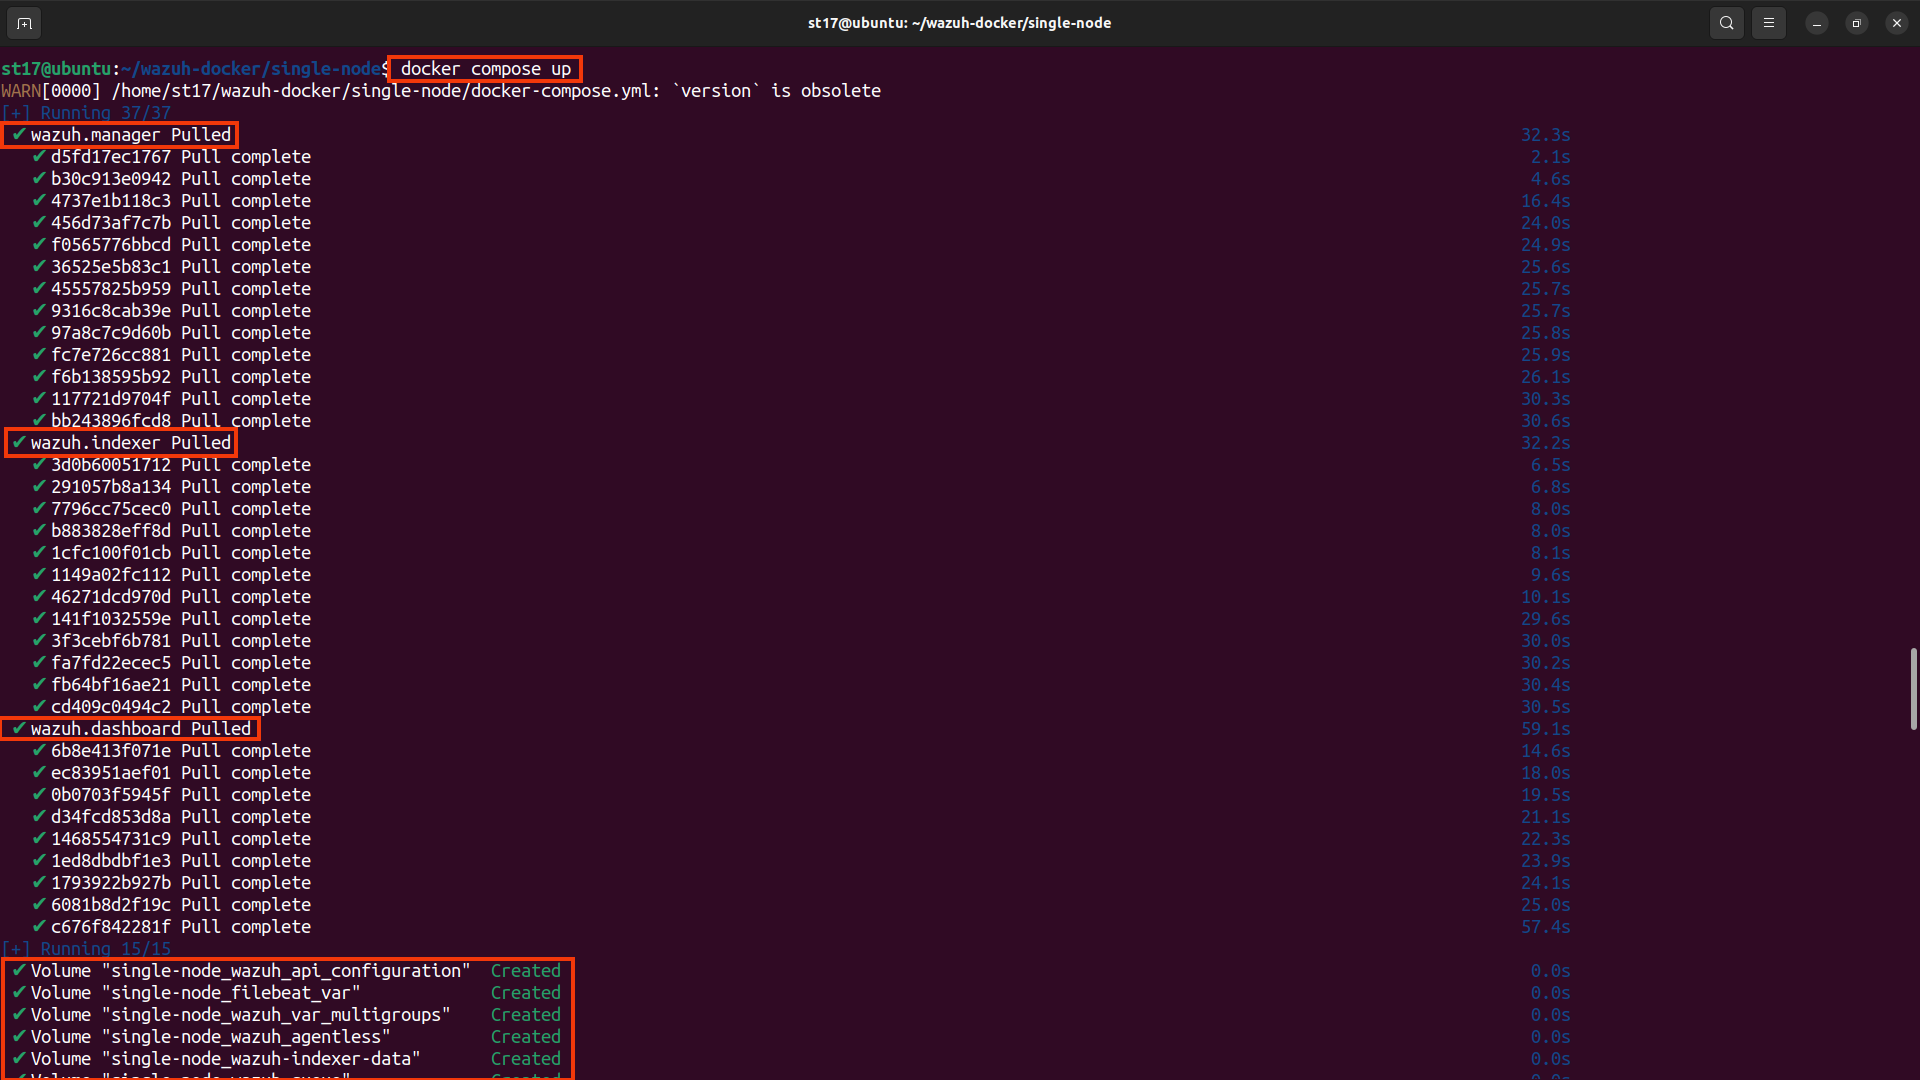
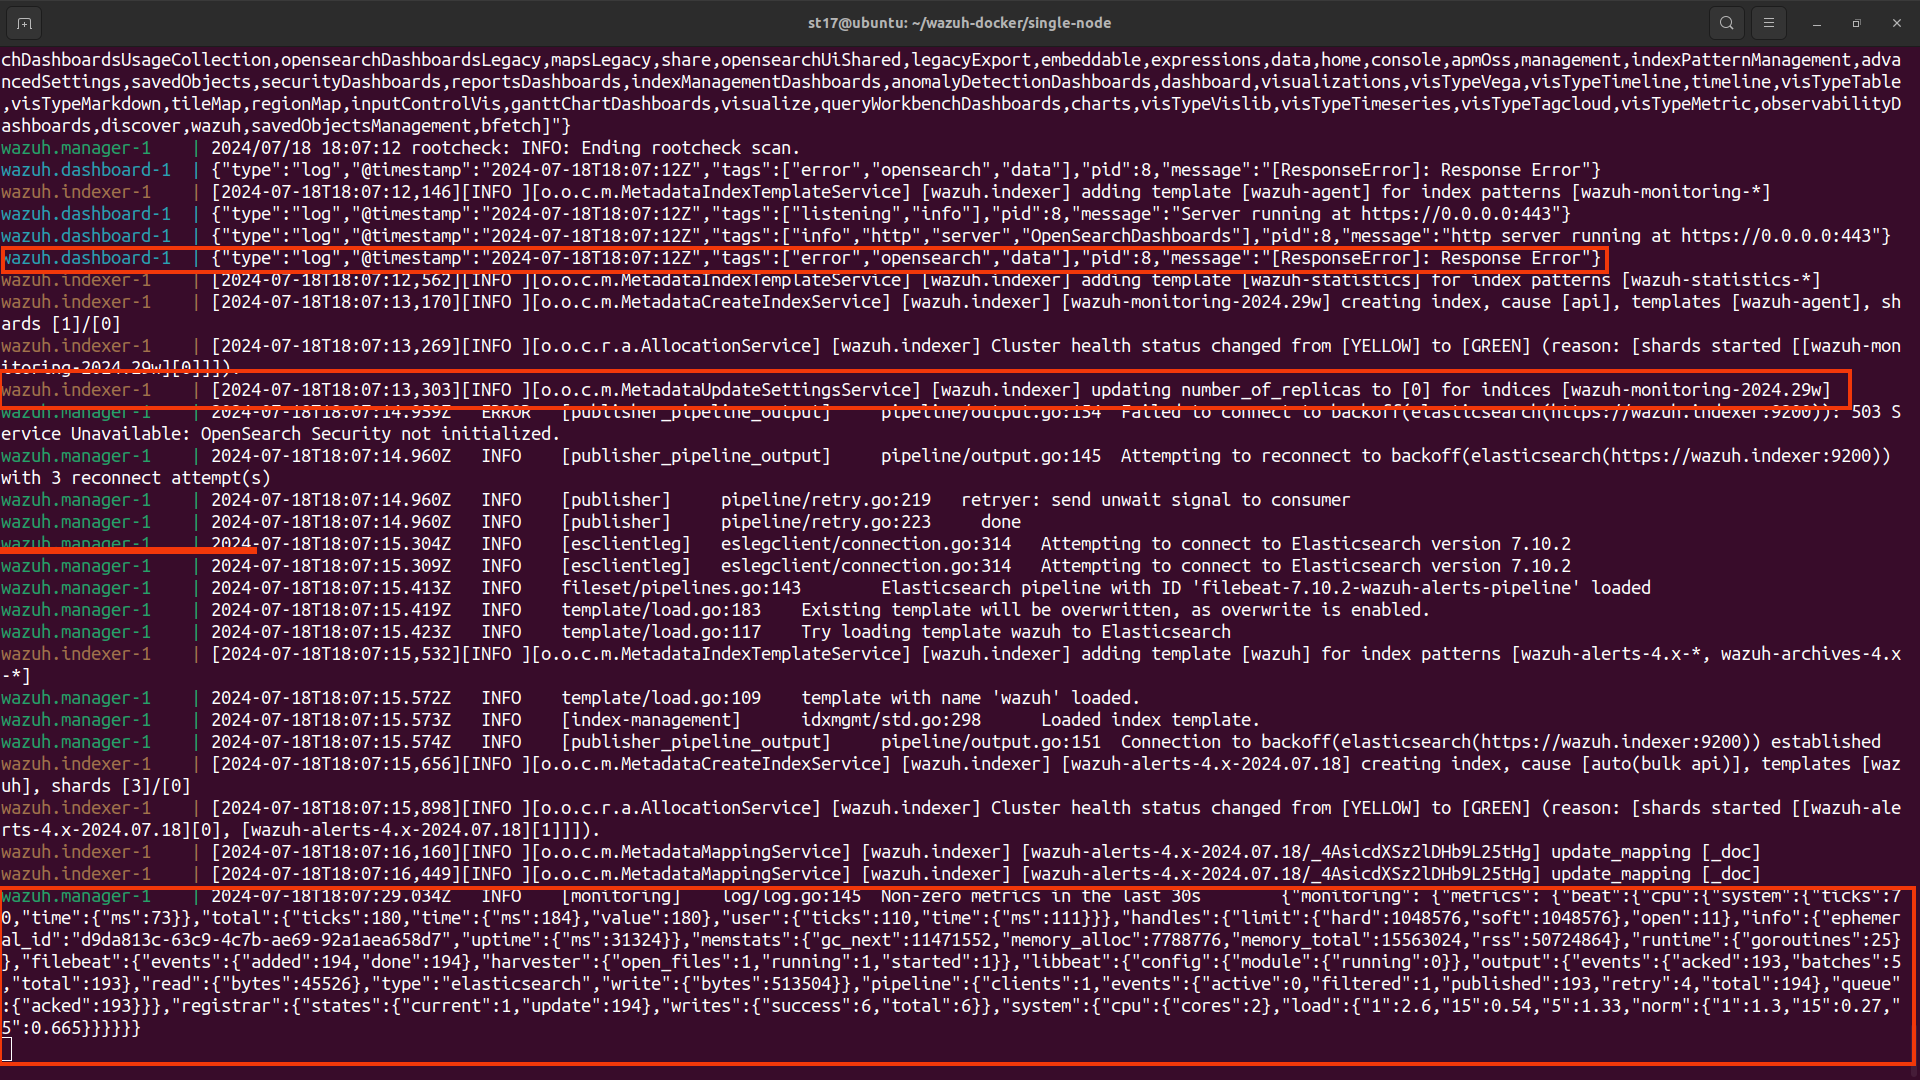
Background:
docker compose up -d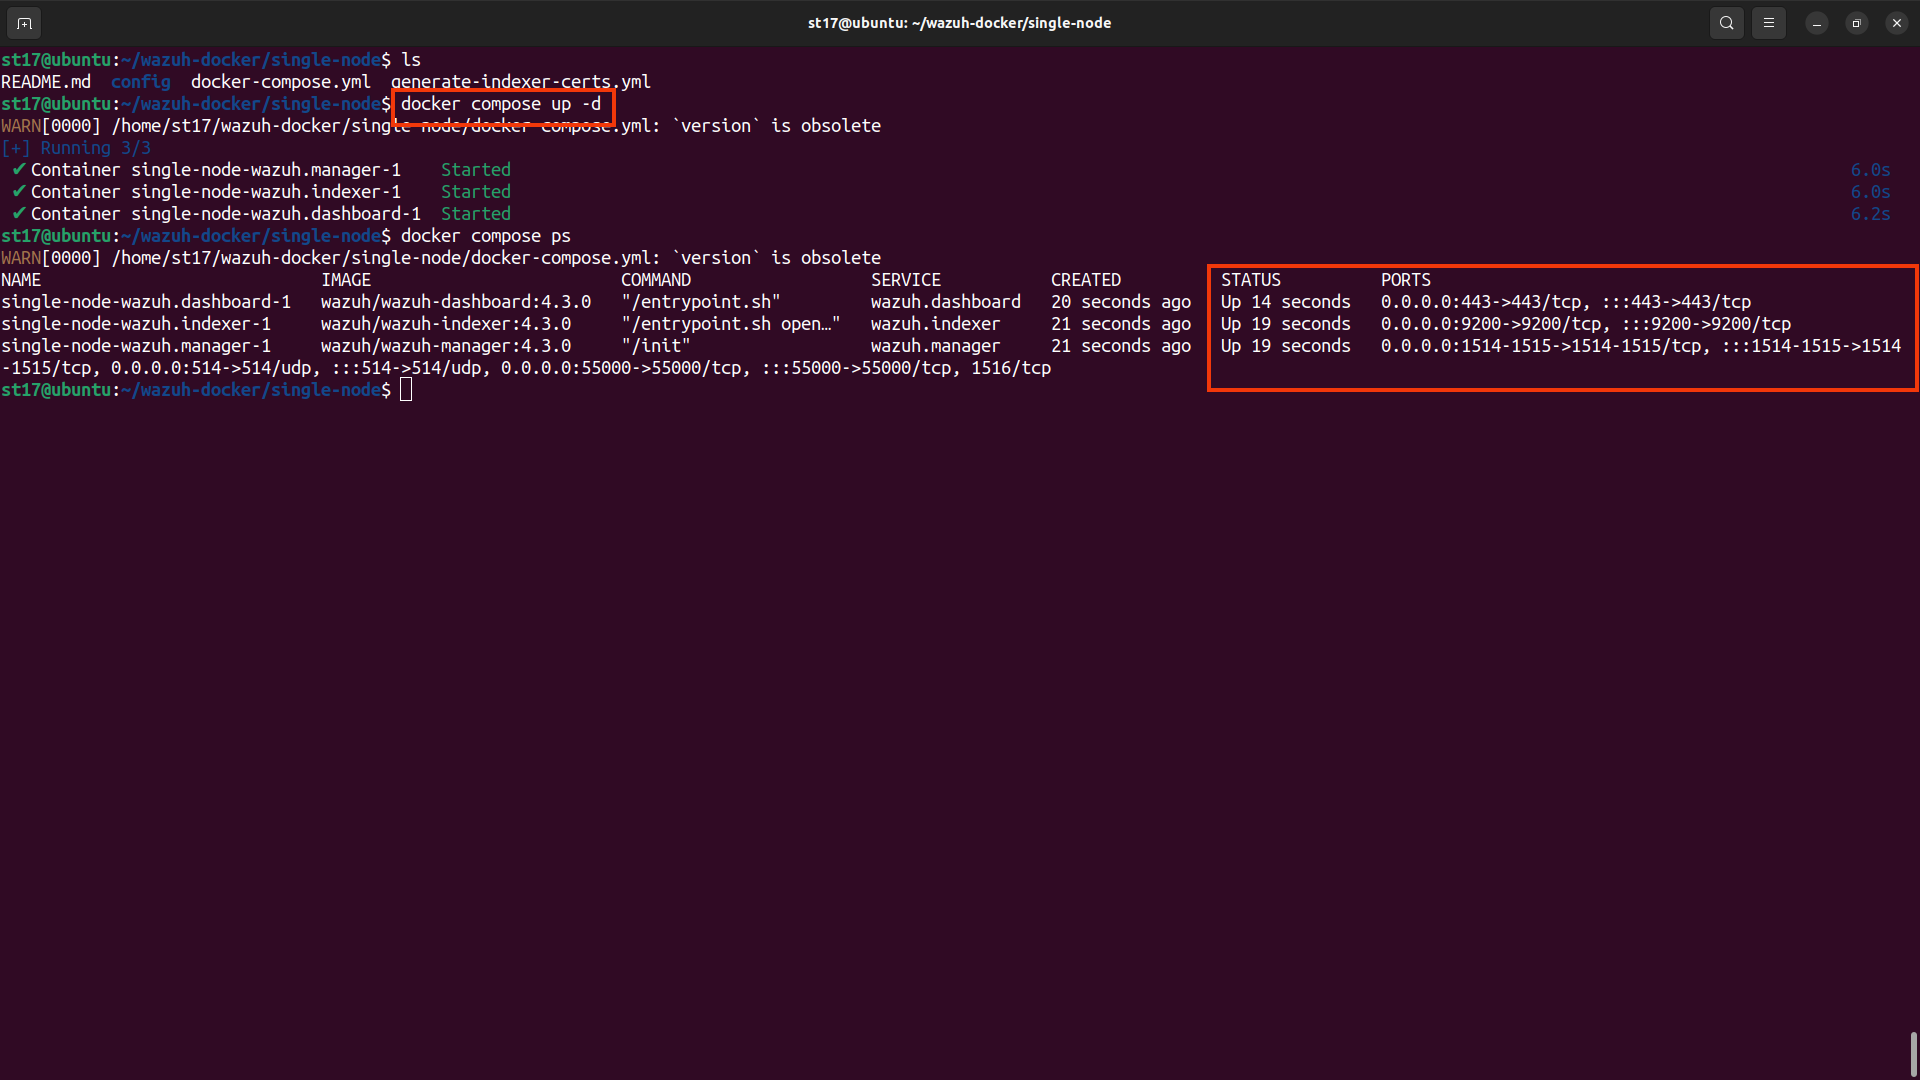
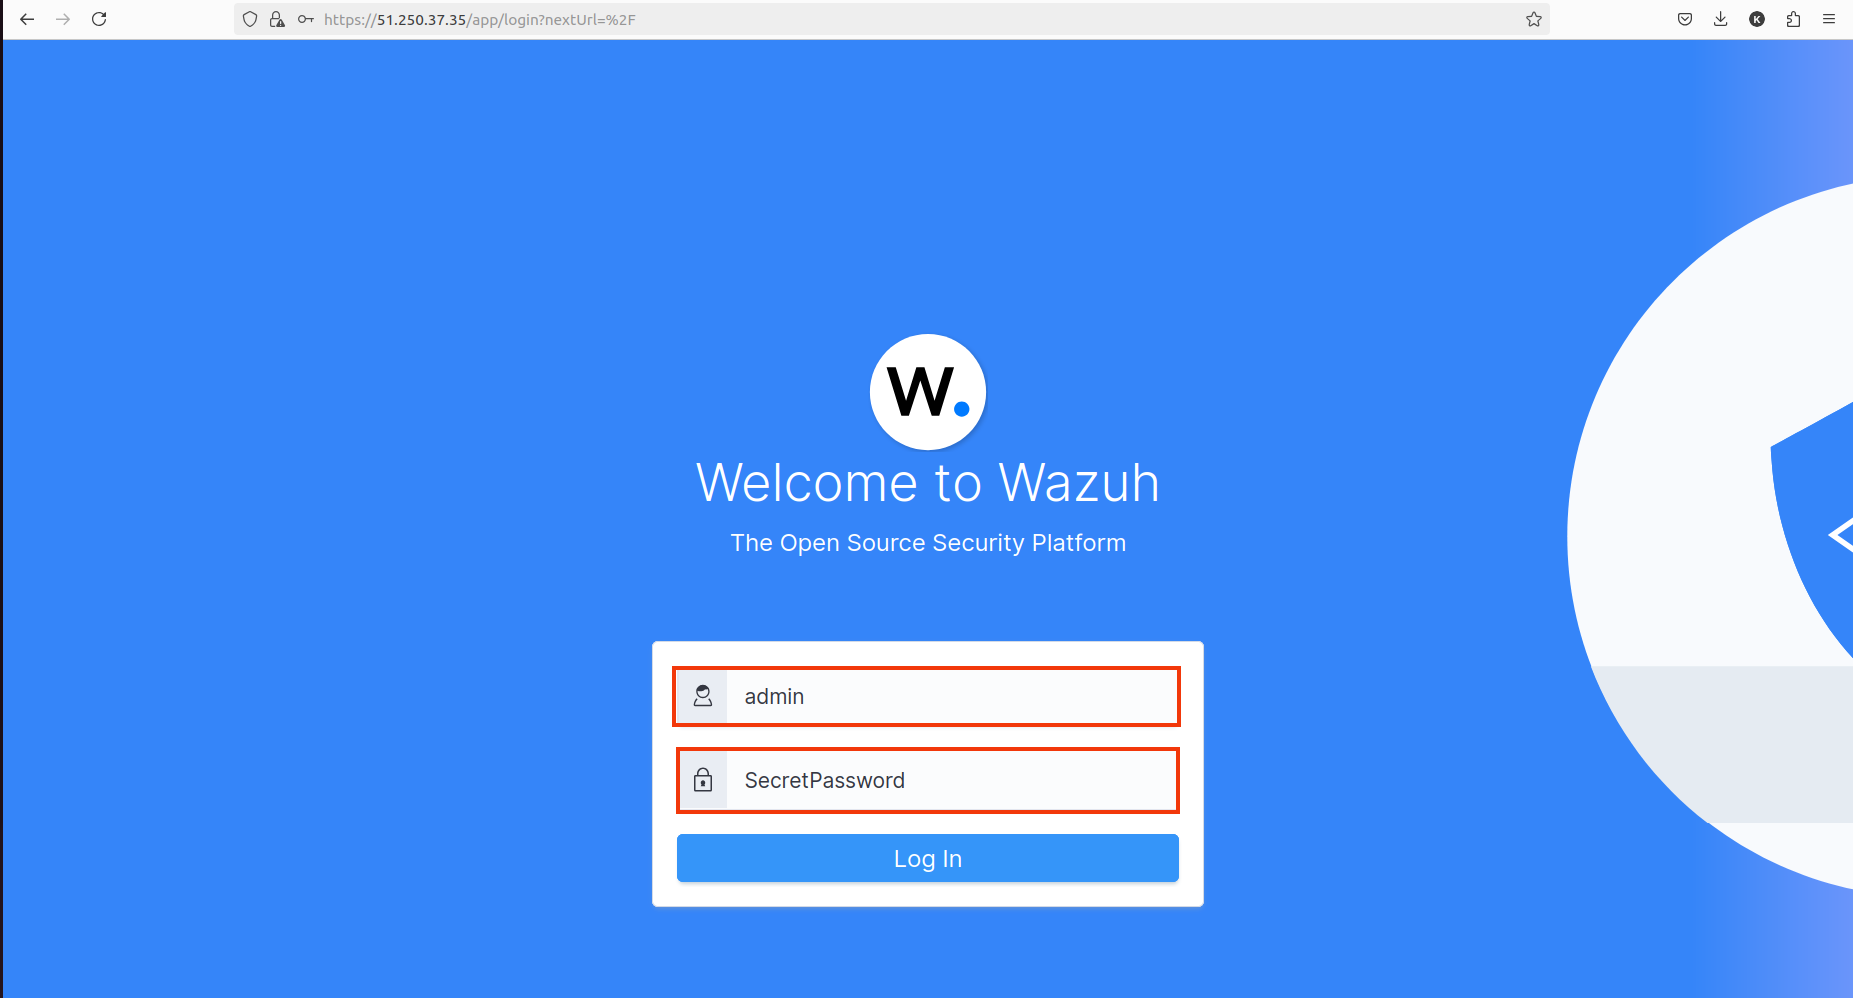
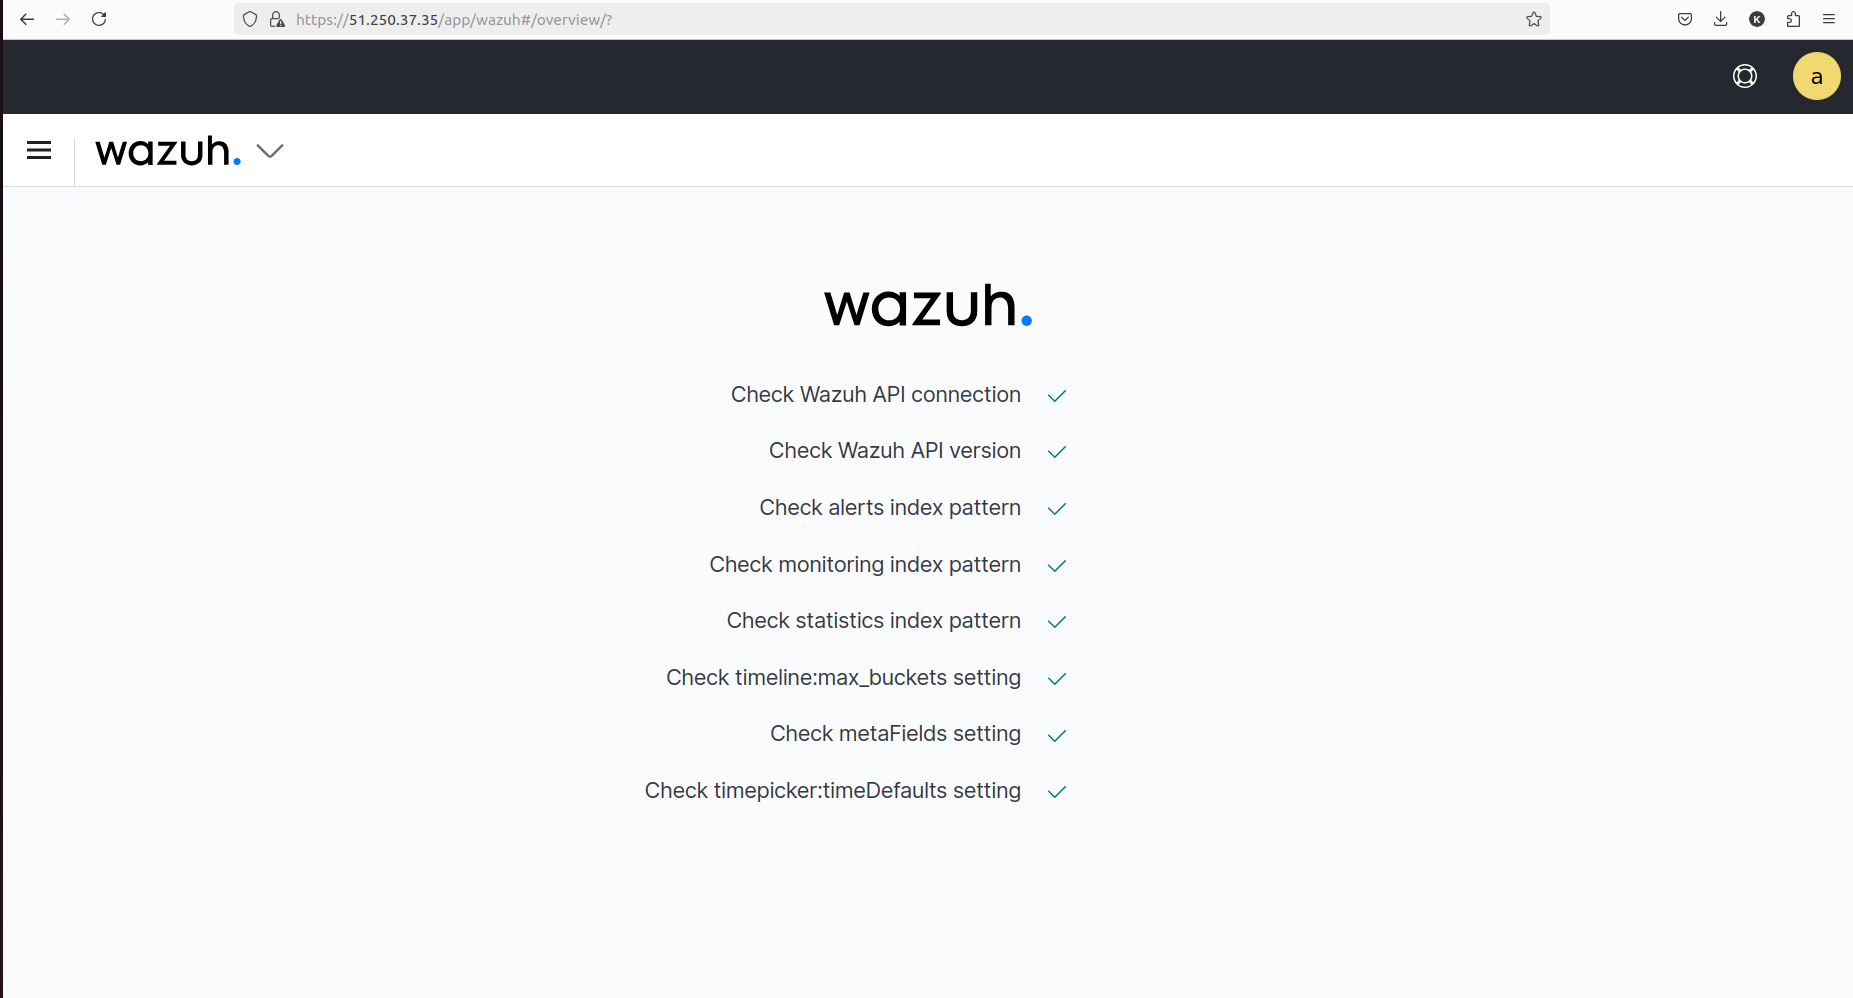
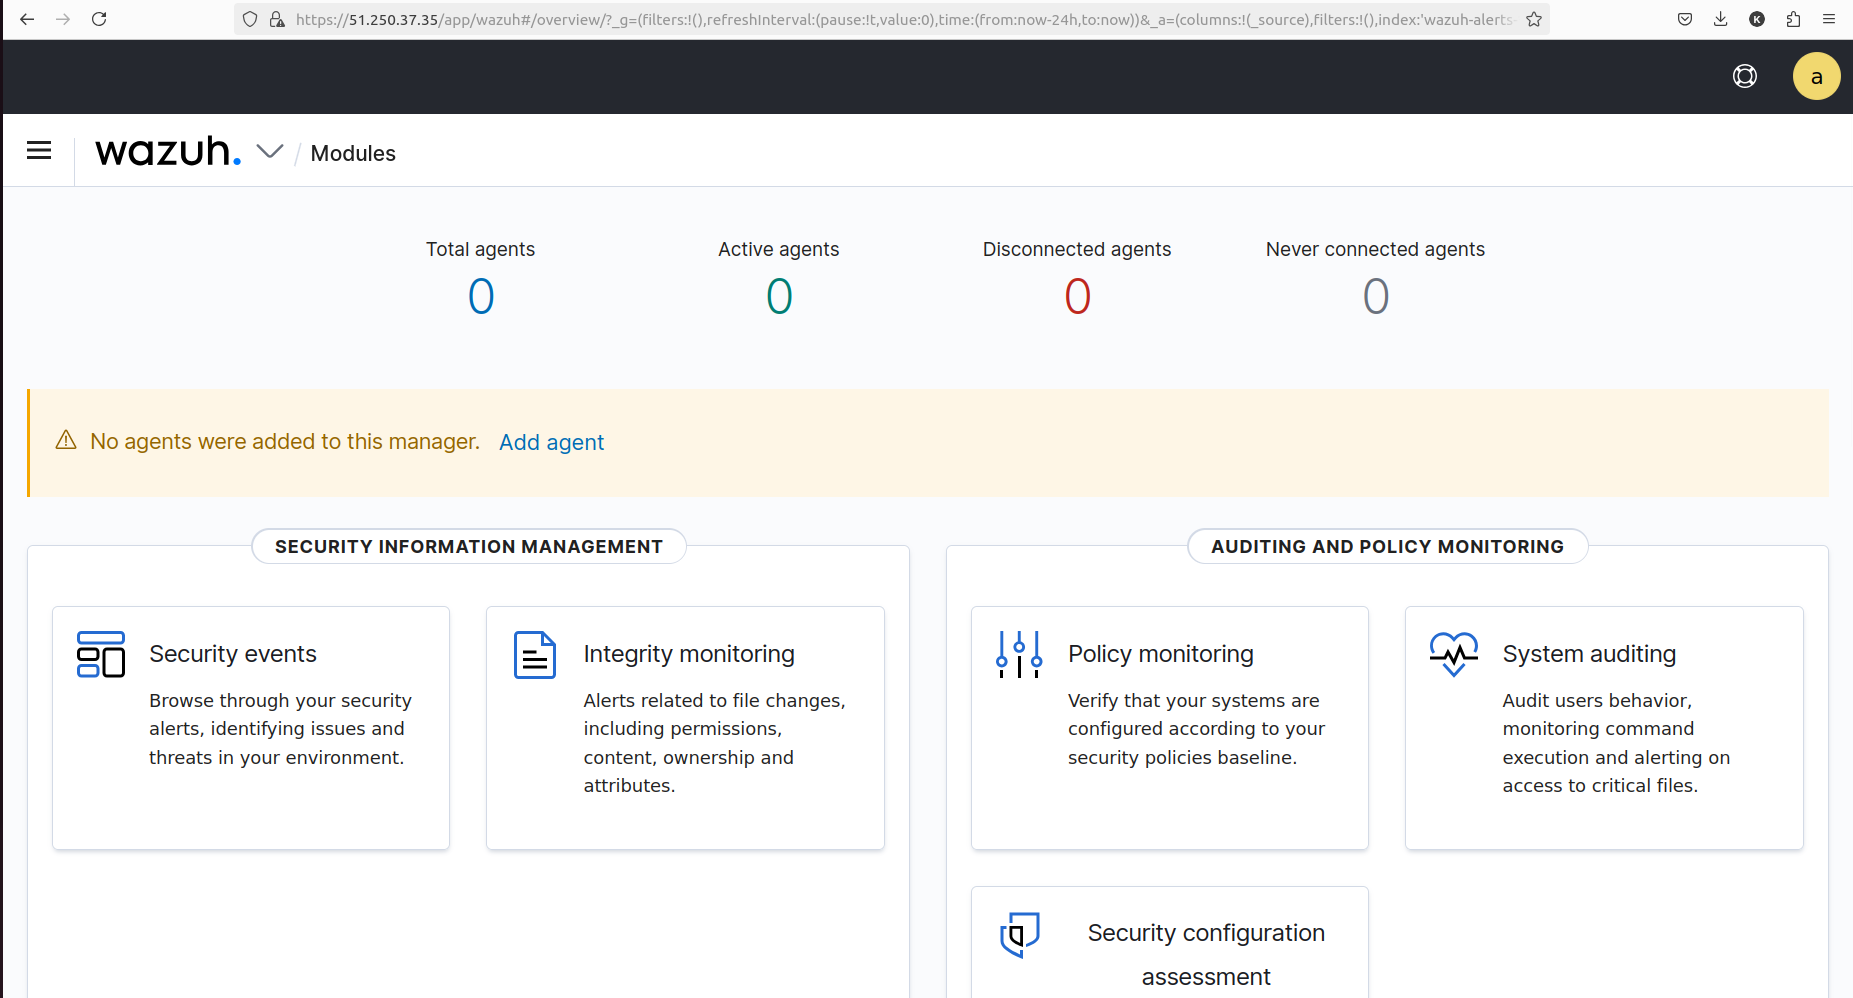
The default username and password for the Wazuh dashboard are
adminandSecretPassword. For additional security, you can change the default password for the Wazuh indexer admin user.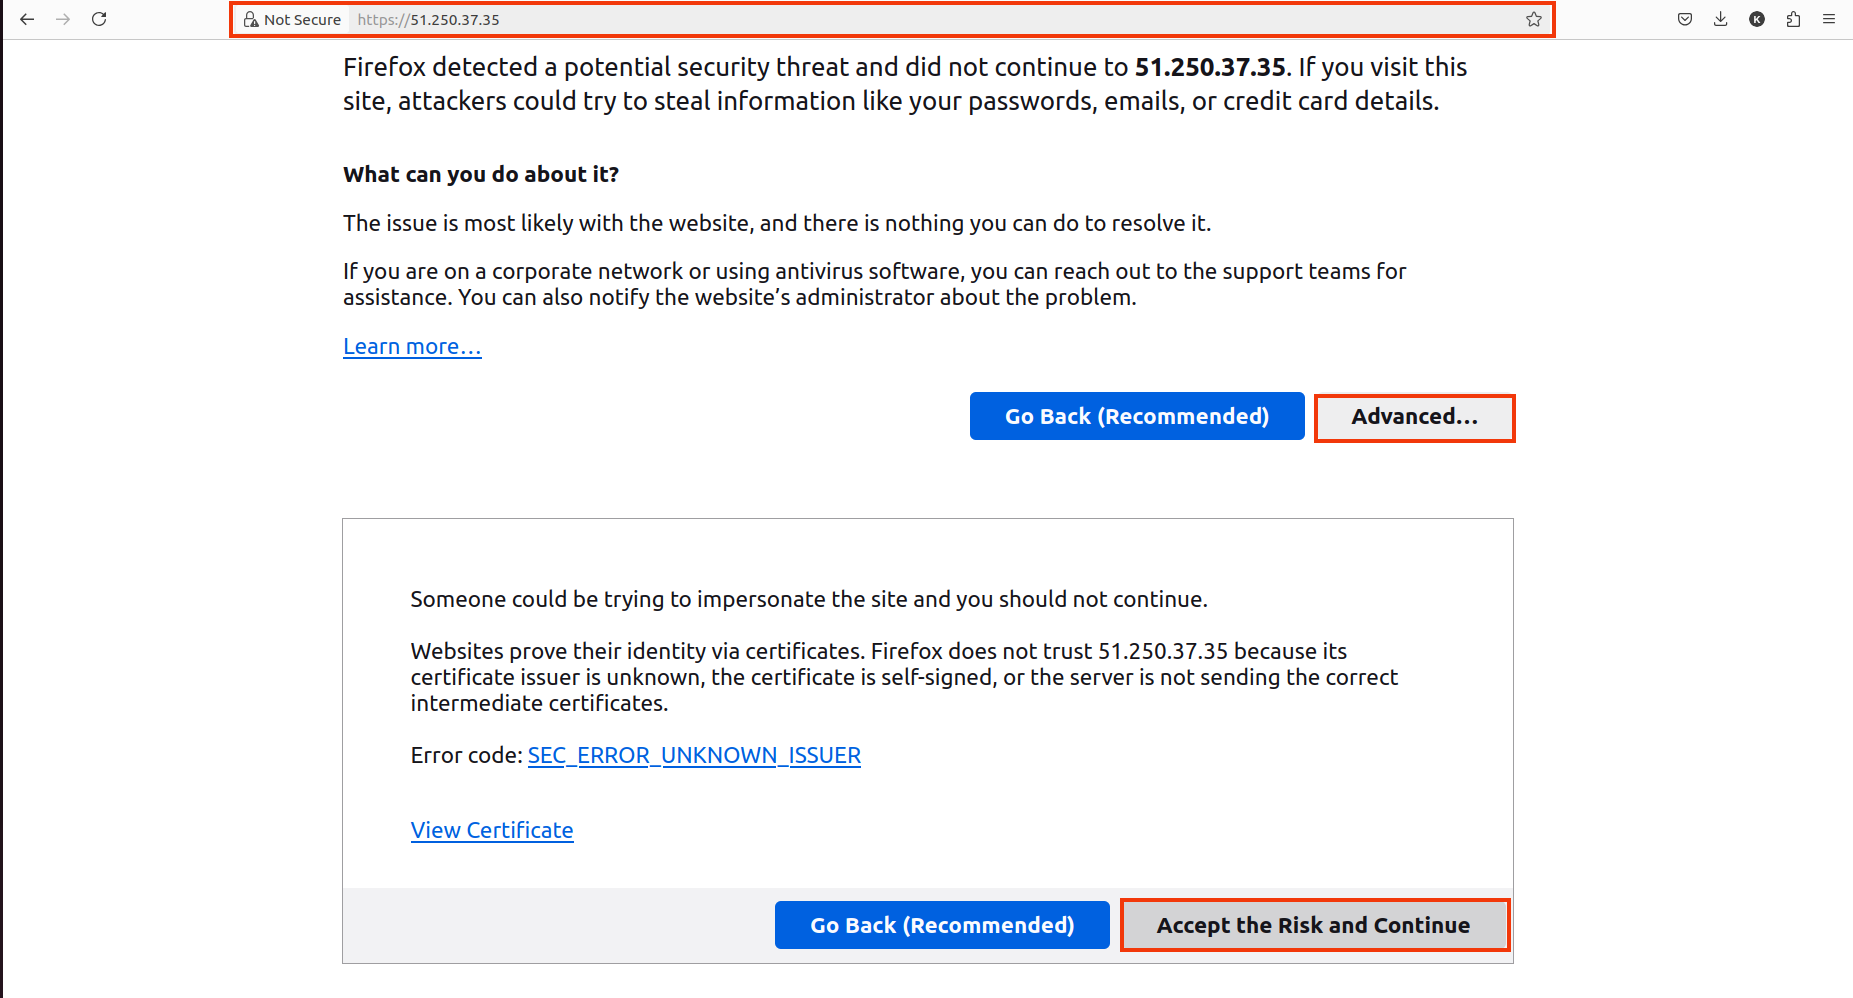
4.3. If you want to deploy it via Docker, use a Linux OS because the certificates are not created properly on Windows OS.1.4.2 Wazuh Manual Deployment
The Wazuh indexer and Wazuh server can be installed on a single host or distributed across multiple hosts in a cluster configuration. There are two main installation methods for each Wazuh central component. Both methods provide instructions for installing the components either on a single host or on separate hosts.
For greater deployment flexibility and customization, you can start with the Wazuh indexer deployment. This approach allows for an all-in-one installation as well as the installation of components on separate servers.
Here is the installation workflow you will follow:
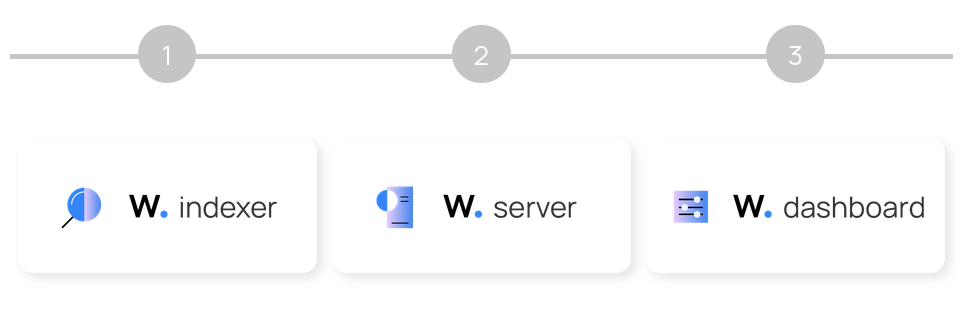
Wazuh Indexer
The Wazuh indexer is a highly scalable, full-text search and analytics engine. This central component indexes and stores alerts generated by the Wazuh server, providing near real-time data search and analytics capabilities.
You can install the Wazuh indexer on a single host or distribute it across multiple nodes in a cluster configuration. A clustered setup offers scalability, high availability, and improved performance.
The installation process is divided into three stages.
Initial configuration
Wazuh indexer nodes installation
Cluster initialization
1. Initial configuration
Indicate your deployment configuration, create the SSL certificates to encrypt communications between the Wazuh components, and generate random passwords to secure your installation.
- Download the Wazuh installation assistant and the configuration file.
curl -sO https://packages.wazuh.com/4.3/wazuh-install.sh
curl -sO https://packages.wazuh.com/4.3/config.yml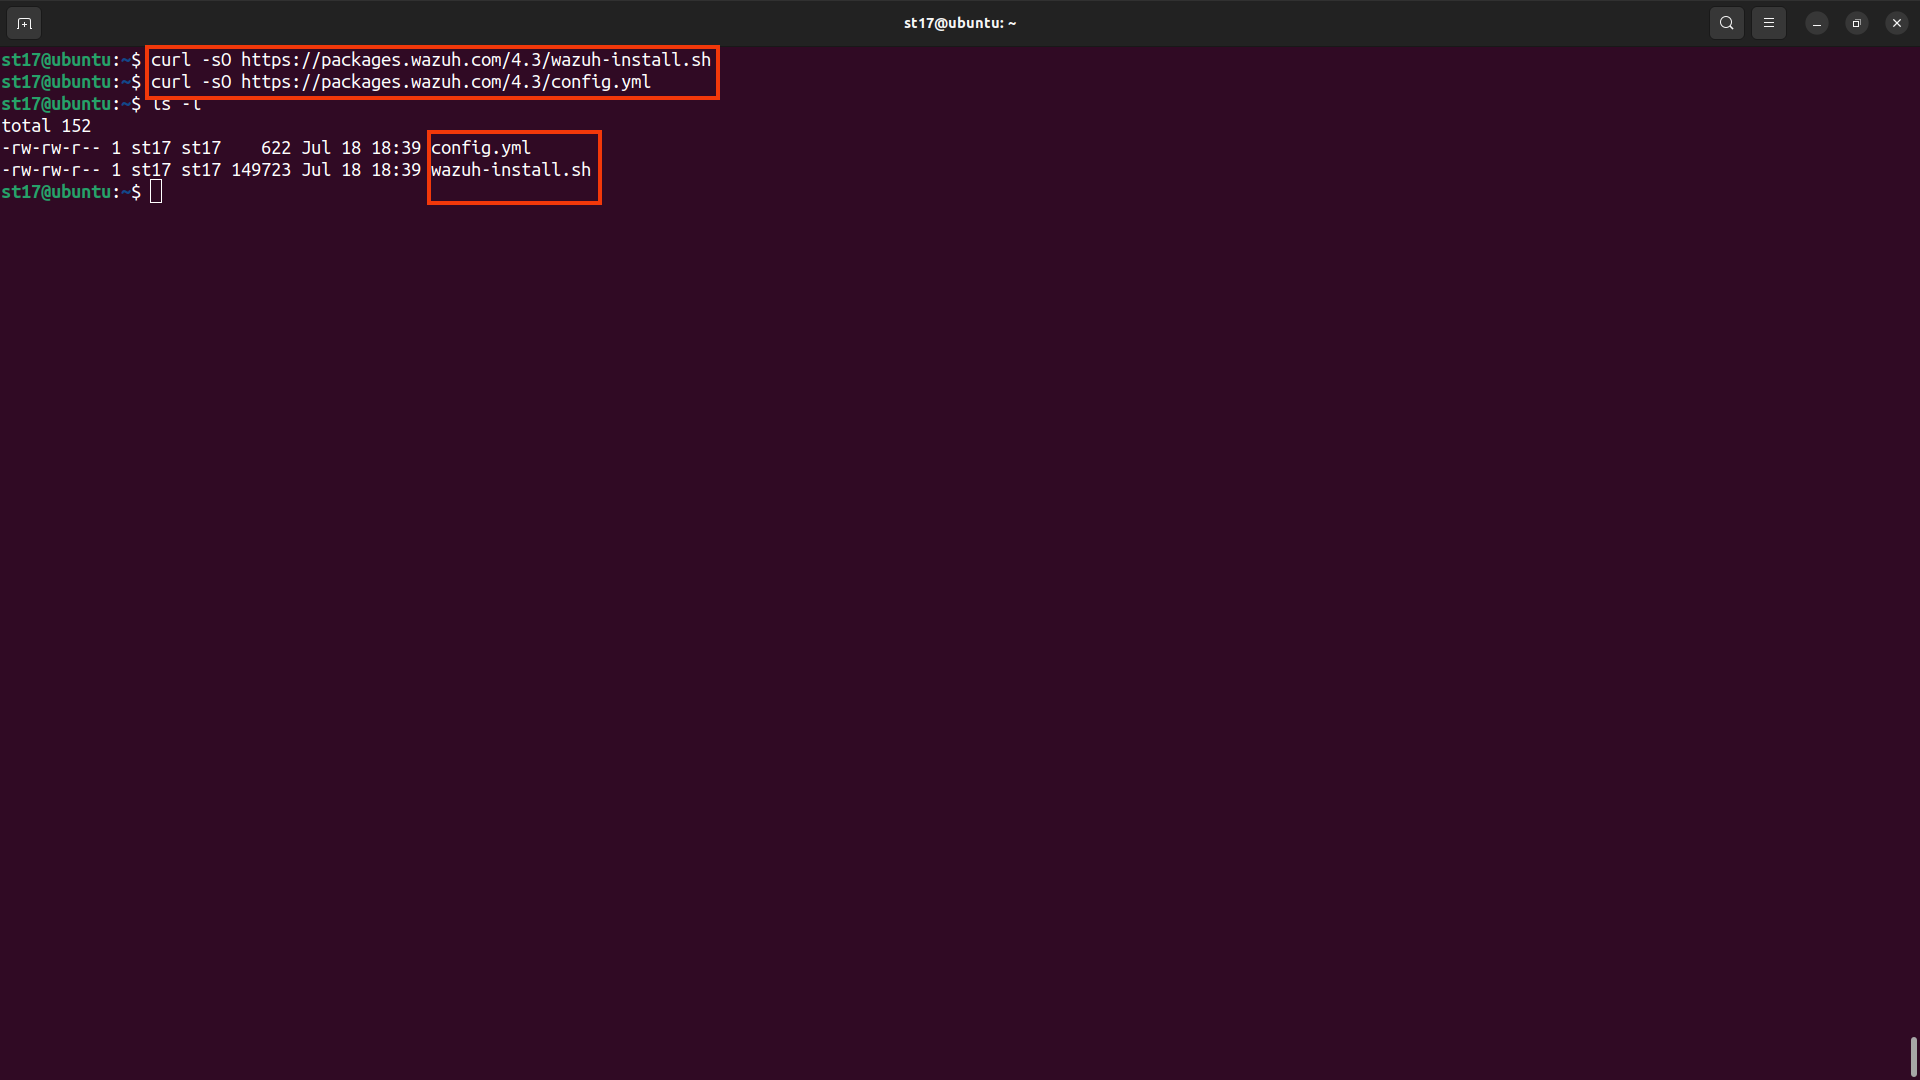
- Edit the
./config.ymland replace the node names and IP values with the corresponding names and IP addresses. You need to do this for all Wazuh server, Wazuh indexer, and Wazuh dashboard nodes. Add as many node fields as needed.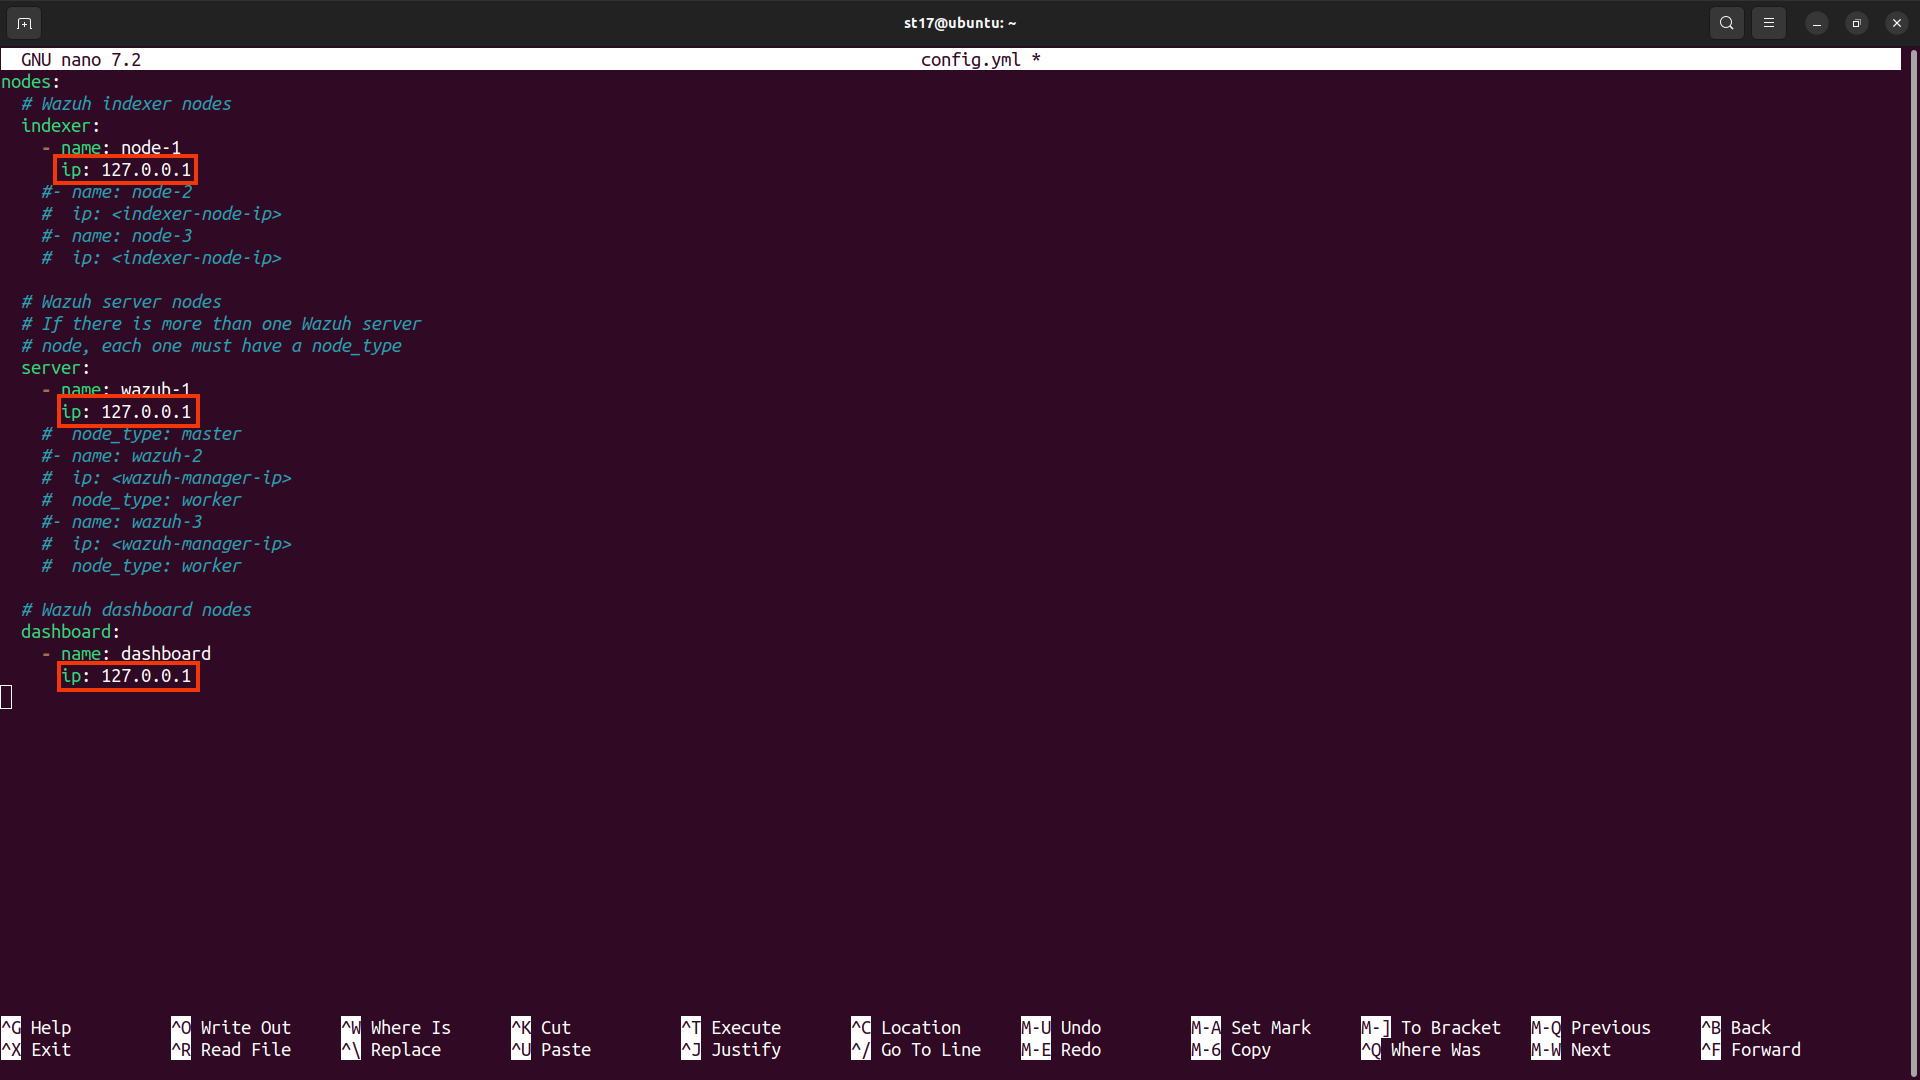
- Run the assistant with the option
--generate-config-filesto generate the Wazuh cluster key, certificates, and passwords necessary for installation. You can find these files in./wazuh-install-files.tar.bash wazuh-install.sh --generate-config-files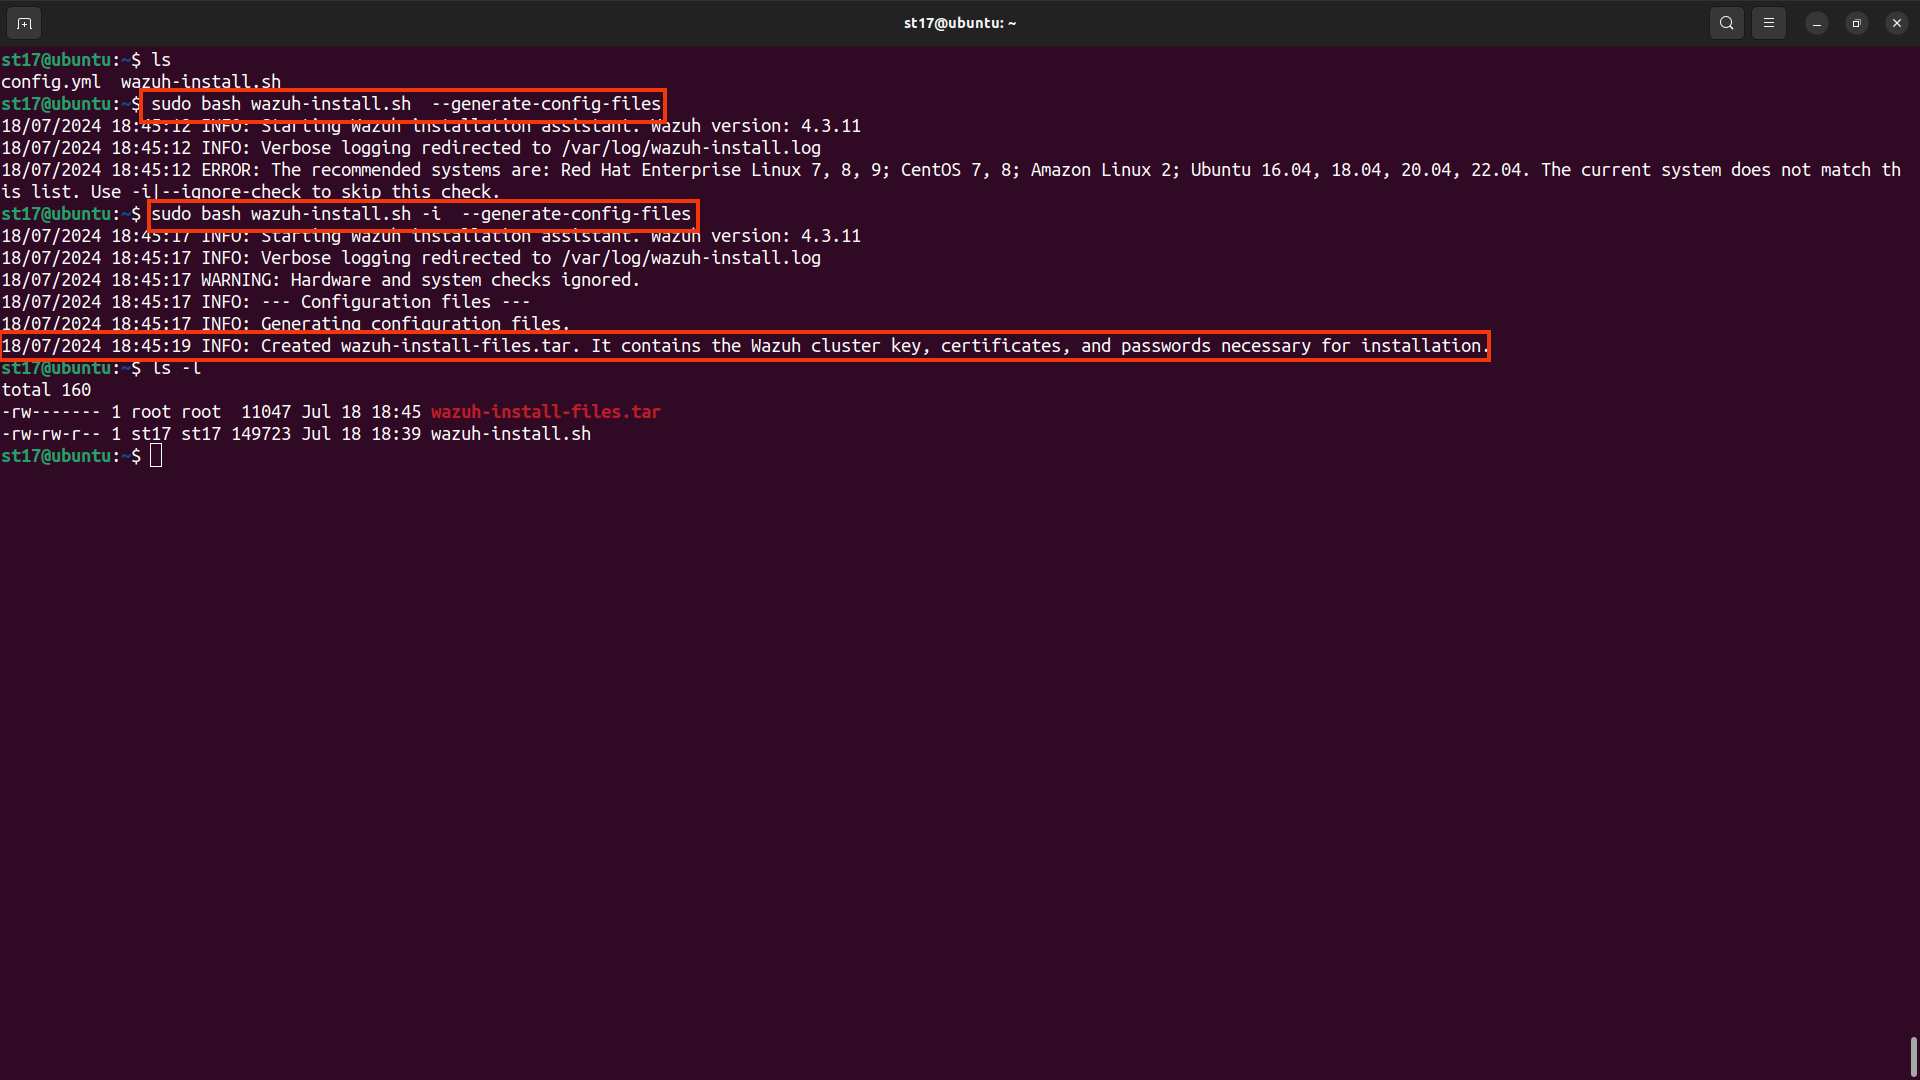 💡Our system does not comply with recommended considerations, which is why we use the -i option to ignore unnecessary checks.
- Copy the
wazuh-install-files.tarfile to all the servers of the distributed deployment, including the Wazuh server, the Wazuh indexer, and the Wazuh dashboard nodes. This can be done by using thescputility.
- Copy the
2. Wazuh indexer nodes installation
Install and configure the Wazuh indexer nodes.
- Download the Wazuh installation assistant.
curl -sO https://packages.wazuh.com/4.3/wazuh-install.sh
- Run the assistant with the option
-wazuh-indexerand the node name to install and configure the Wazuh indexer. The node name must be the same one used inconfig.ymlfor the initial configuration, for example,node-1.💡Make sure that a copy ofwazuh-install-files.tar, created during the initial configuration step, is placed in your working directory.bash wazuh-install.sh --wazuh-indexer node-1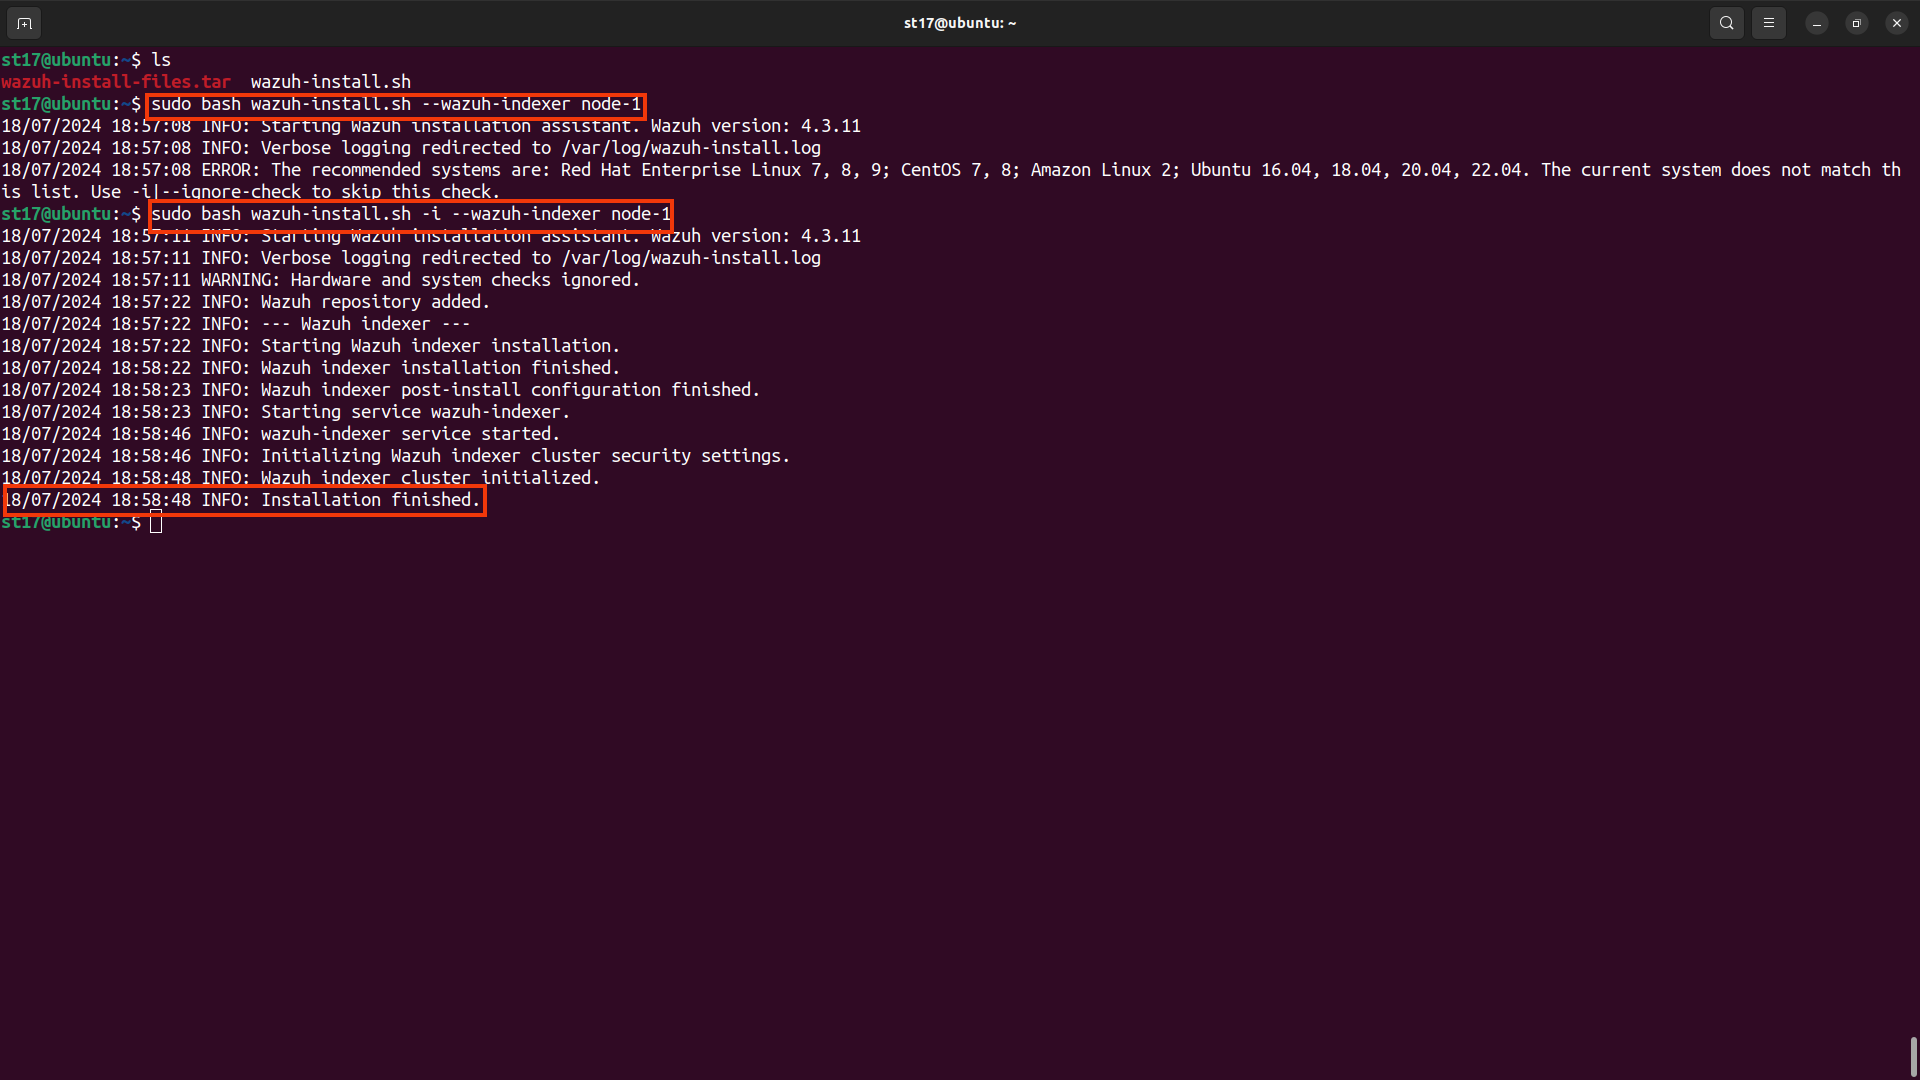 💡Our system does not comply with recommended considerations, which is why we use the -i option to ignore unnecessary checks.
Repeat this stage of the installation process for every Wazuh indexer node in your cluster. Then proceed with initializing your single-node or multi-node cluster in the next stage.
3. Cluster initialization
The final stage of installing the Wazuh indexer single-node or multi-node cluster consists of running the security admin script.
- Run the Wazuh installation assistant with option
-start-clusteron any Wazuh indexer node to load the new certificates information and start the cluster.bash wazuh-install.sh --start-cluster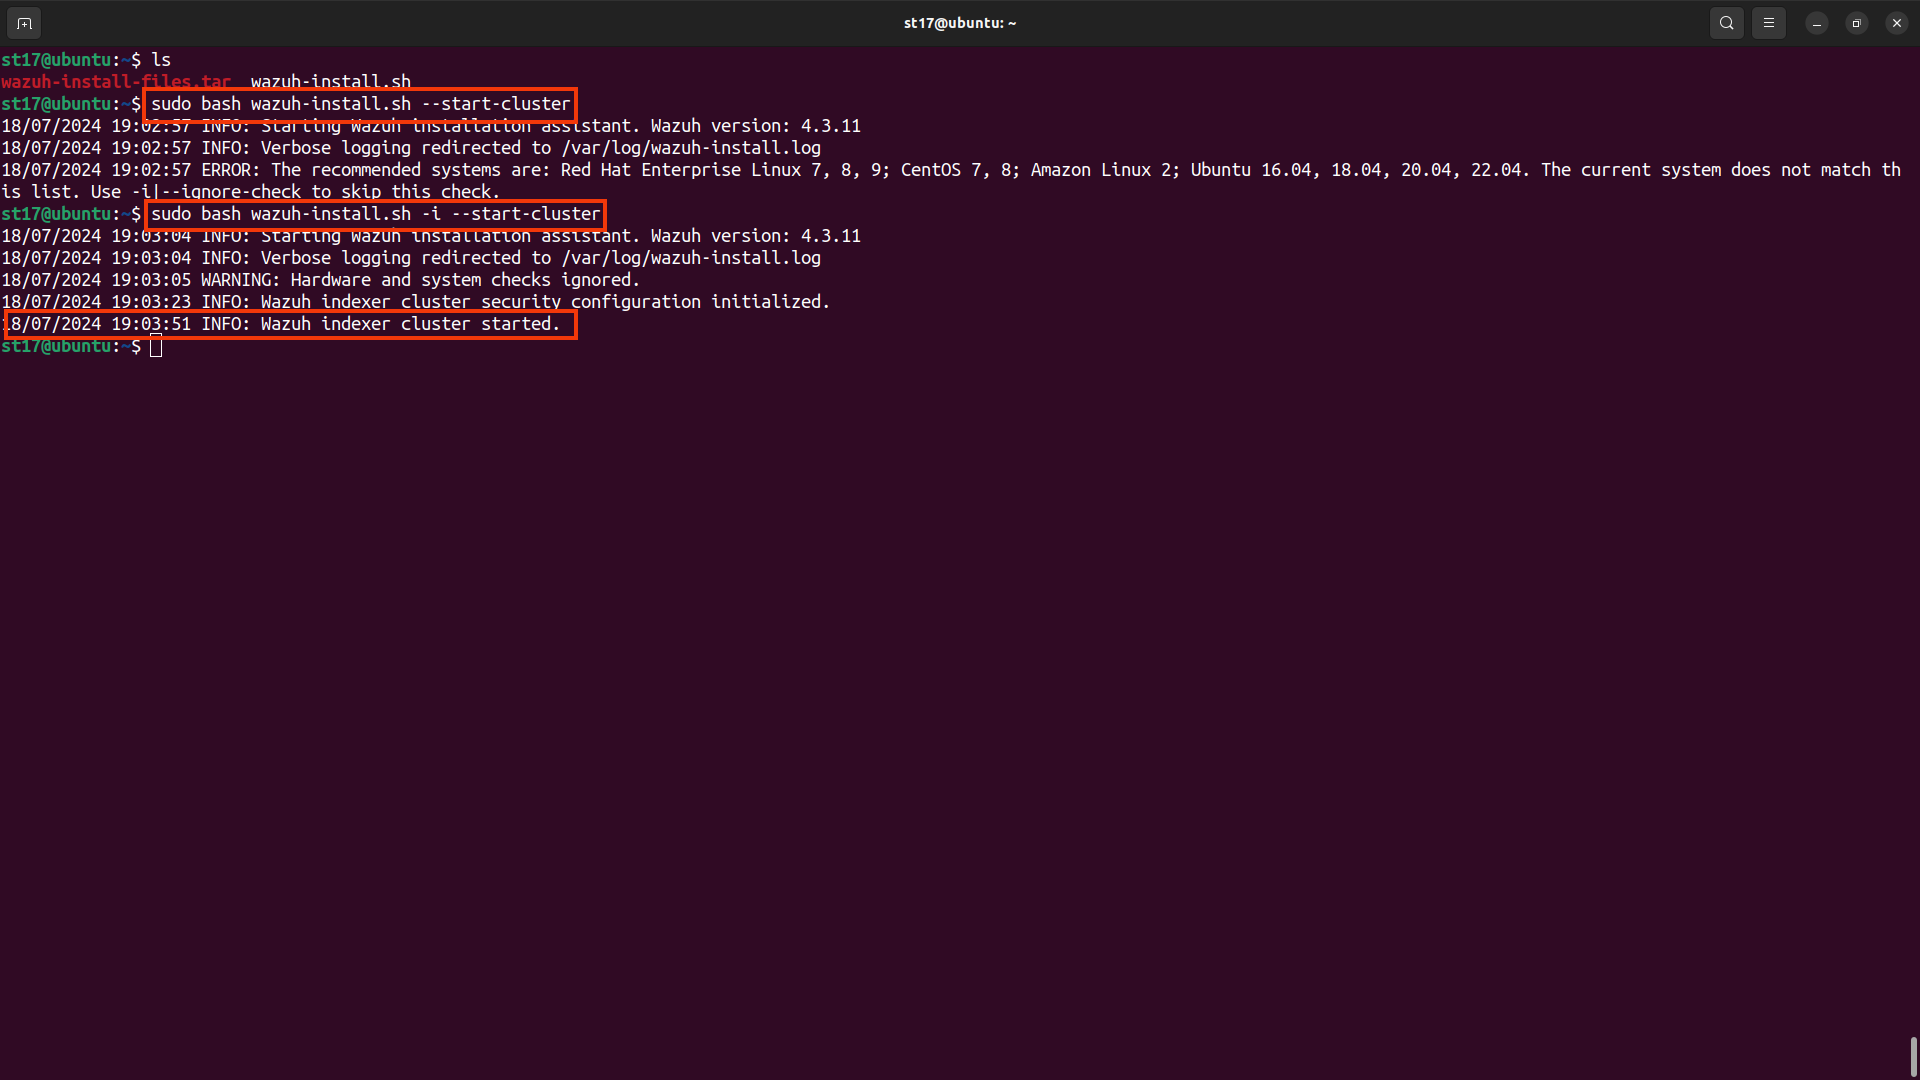 💡You only have to initialize the cluster once, there is no need to run this command on every node.
Testing the cluster installation
- Run the following command to get the admin password:
curl -k -u admin:<ADMIN_PASSWORD> https://<WAZUH_INDEXER_IP>:9200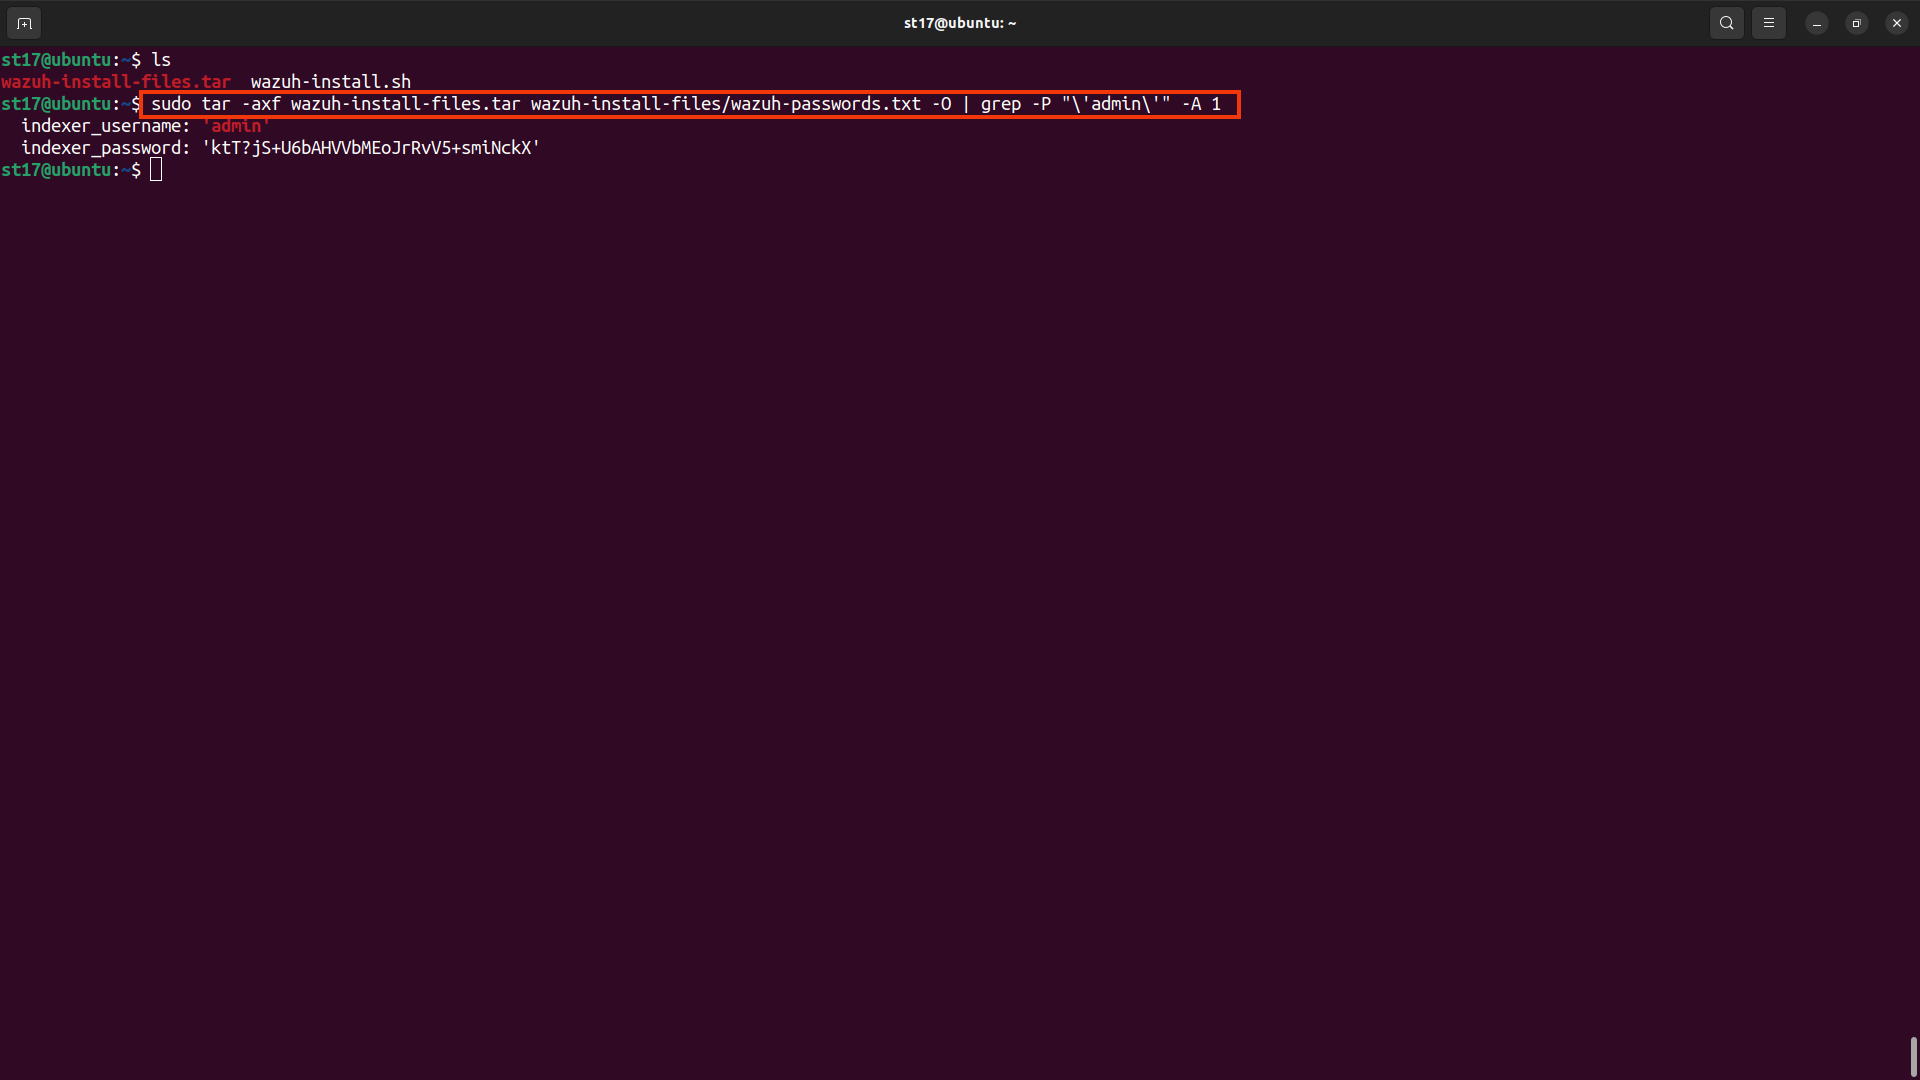
- Run the following command to confirm that the installation is successful. Replace
<ADMIN_PASSWORD>with the password gotten from the output of the previous command. Replace<WAZUH_INDEXER_IP>with the configured Wazuh indexer IP address:curl -k -u admin:<ADMIN_PASSWORD> https://<WAZUH_INDEXER_IP>:9200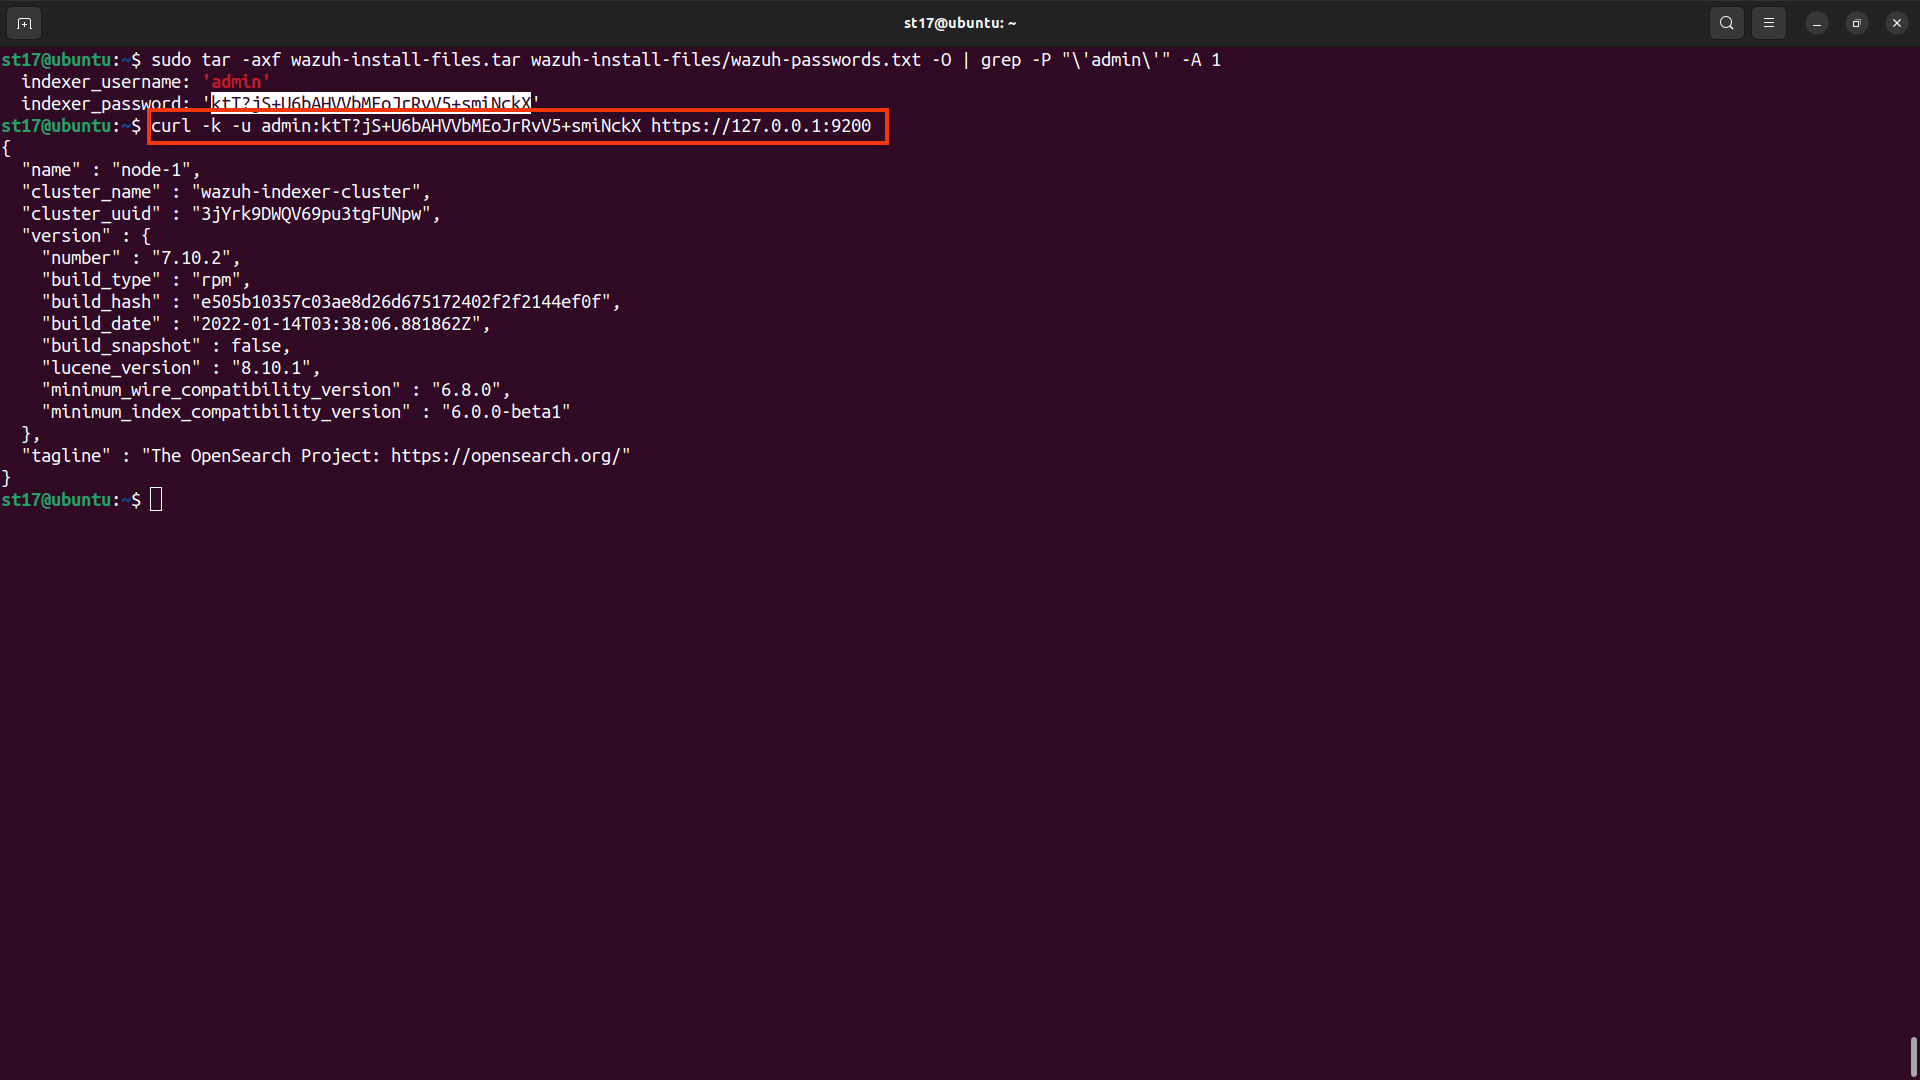
- Replace
<WAZUH_INDEXER_IP>and<ADMIN_PASSWORD>, and run the following command to check if the cluster is working correctly:curl -k -u admin:<ADMIN_PASSWORD> https://<WAZUH_INDEXER_IP>:9200/_cat/nodes?v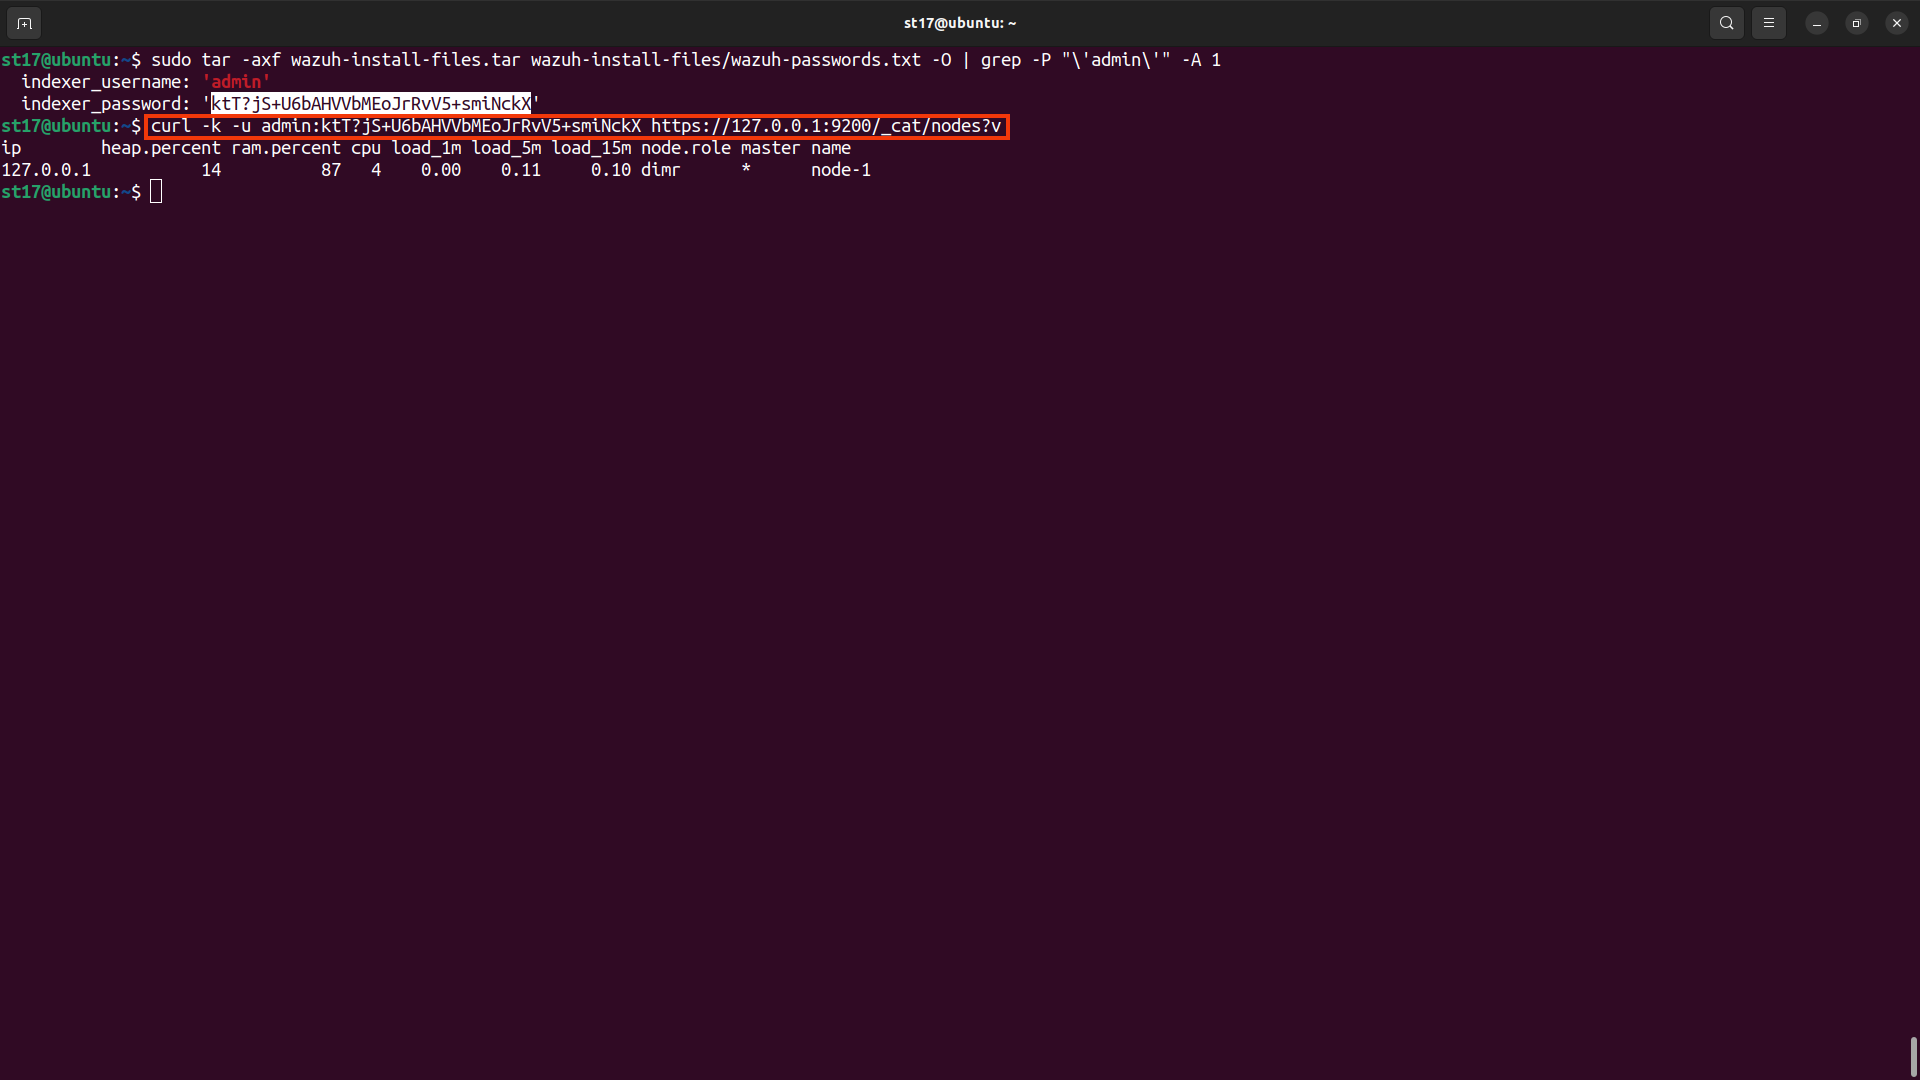
The Wazuh indexer is now successfully installed, and you can proceed with installing the Wazuh server.
Wazuh Server
The Wazuh server analyzes data received from Wazuh agents, triggering alerts when threats or anomalies are detected. It also allows for remote management of agent configurations and monitoring their status.
You can install the Wazuh server on a single host or distribute it across multiple nodes in a cluster configuration. Multi-node configurations offer high availability and improved performance. When combined with a network load balancer, this setup can efficiently utilize its capacity.
Wazuh server cluster installation
- Download the Wazuh installation assistant:
curl -sO https://packages.wazuh.com/4.3/wazuh-install.sh
- Run the assistant with the option
--wazuh-serverfollowed by the node name to install the Wazuh server. The node name must be the same one used inconfig.ymlfor the initial configuration, for example,wazuh-1.💡Make sure that a copy of thewazuh-install-files.tar, created during the initial configuration step, is placed in your working directory.bash wazuh-install.sh --wazuh-server wazuh-1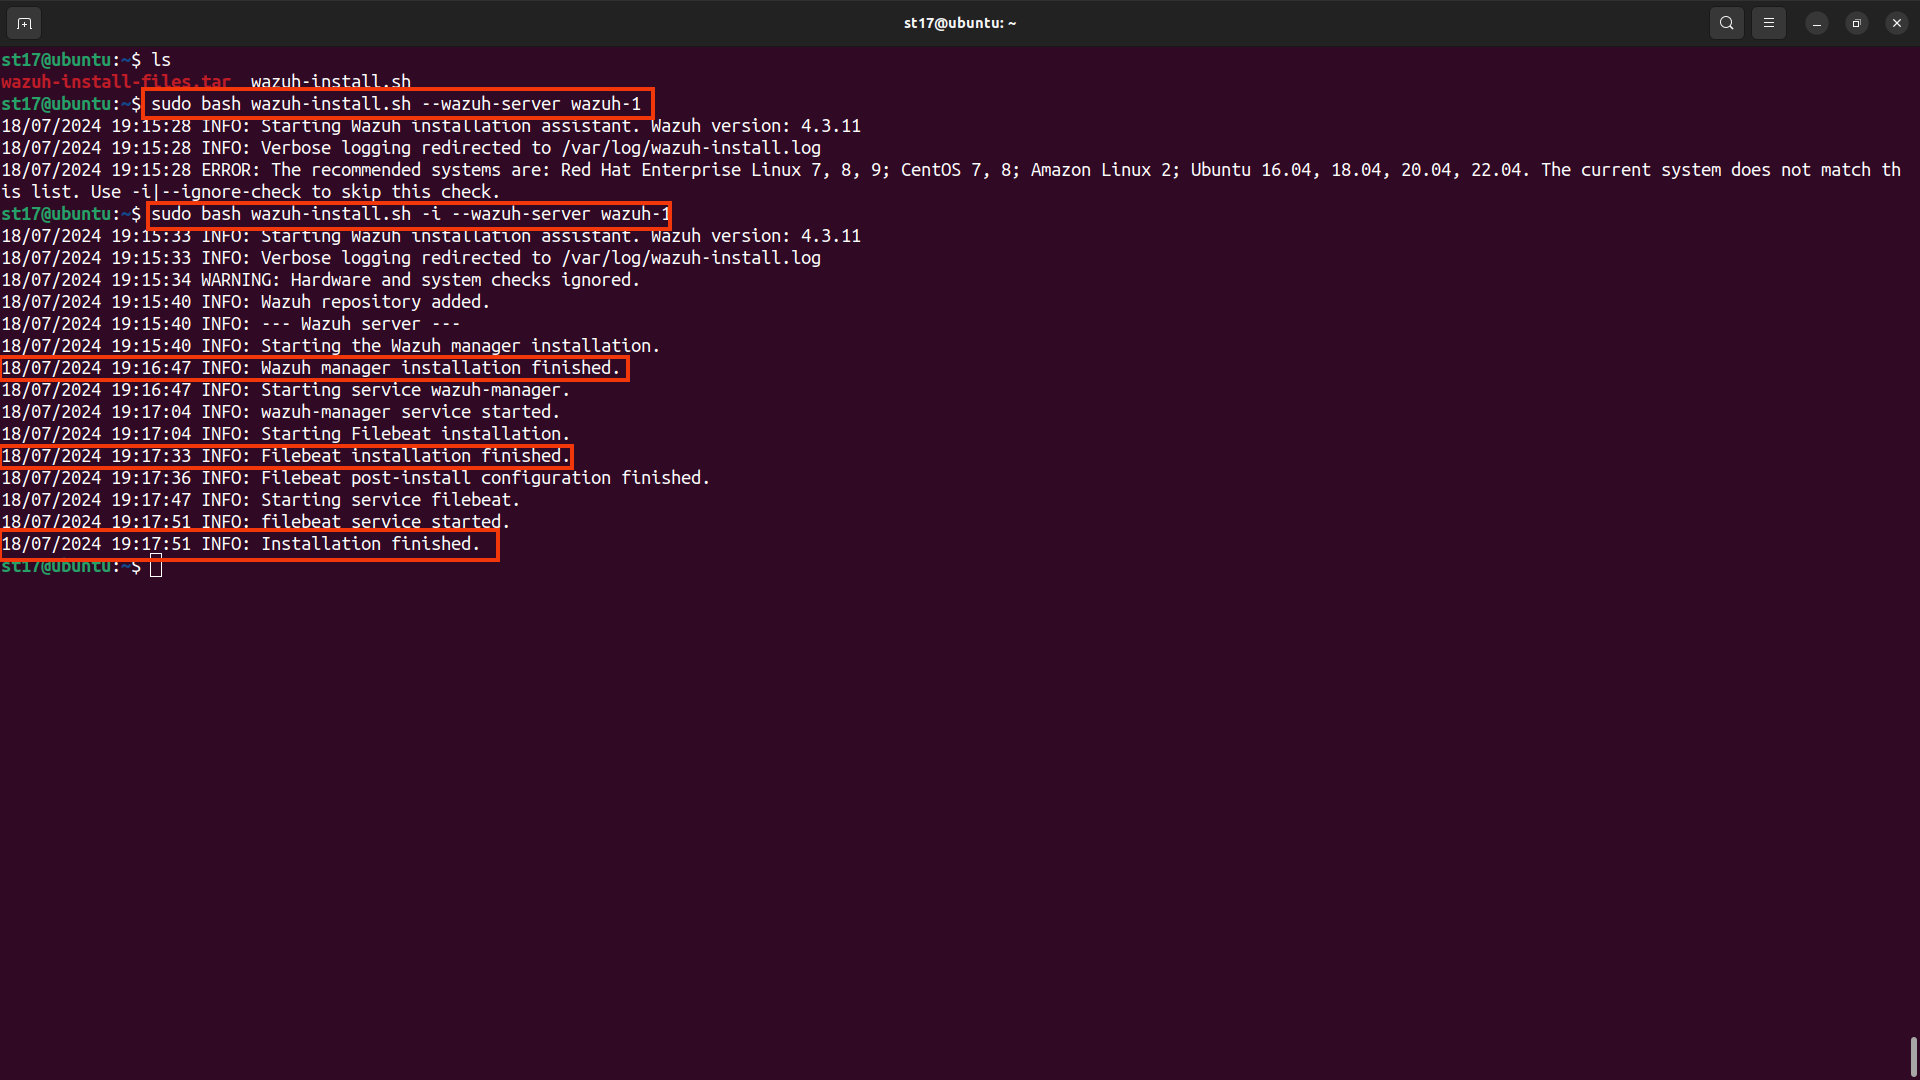 💡Our system does not comply with recommended considerations, which is why we use the -i option to ignore unnecessary checks.
Your Wazuh server is now successfully installed.
- If you want a Wazuh server single-node cluster, everything is set and you can proceed directly with Installing the Wazuh dashboard using the assistant.
- If you want a Wazuh server multi-node cluster, repeat this process on every Wazuh server node.
The Wazuh server installation is now complete, and you can proceed with installing the Wazuh dashboard.
Wazuh Dashboard
The Wazuh dashboard is a flexible and intuitive web interface for mining, analyzing, and visualizing security data. It provides out-of-the-box dashboards, allowing seamless navigation through the user interface.
With the Wazuh dashboard, users can visualize security events, detected vulnerabilities, file integrity monitoring data, configuration assessment results, cloud infrastructure monitoring events, and regulatory compliance standards.
Wazuh dashboard installation
- Download the Wazuh installation assistant. This step can be skipped if you have already installed Wazuh indexer on the same server.
curl -sO https://packages.wazuh.com/4.3/wazuh-install.sh
- Run the assistant with the option
--wazuh-dashboardand the node name to install and configure the Wazuh dashboard. The node name must be the same one used inconfig.ymlfor the initial configuration, for example,dashboard.💡Make sure that a copy of thewazuh-install-files.tar, created during the initial configuration step, is placed in your working directory.bash wazuh-install.sh --wazuh-dashboard dashboard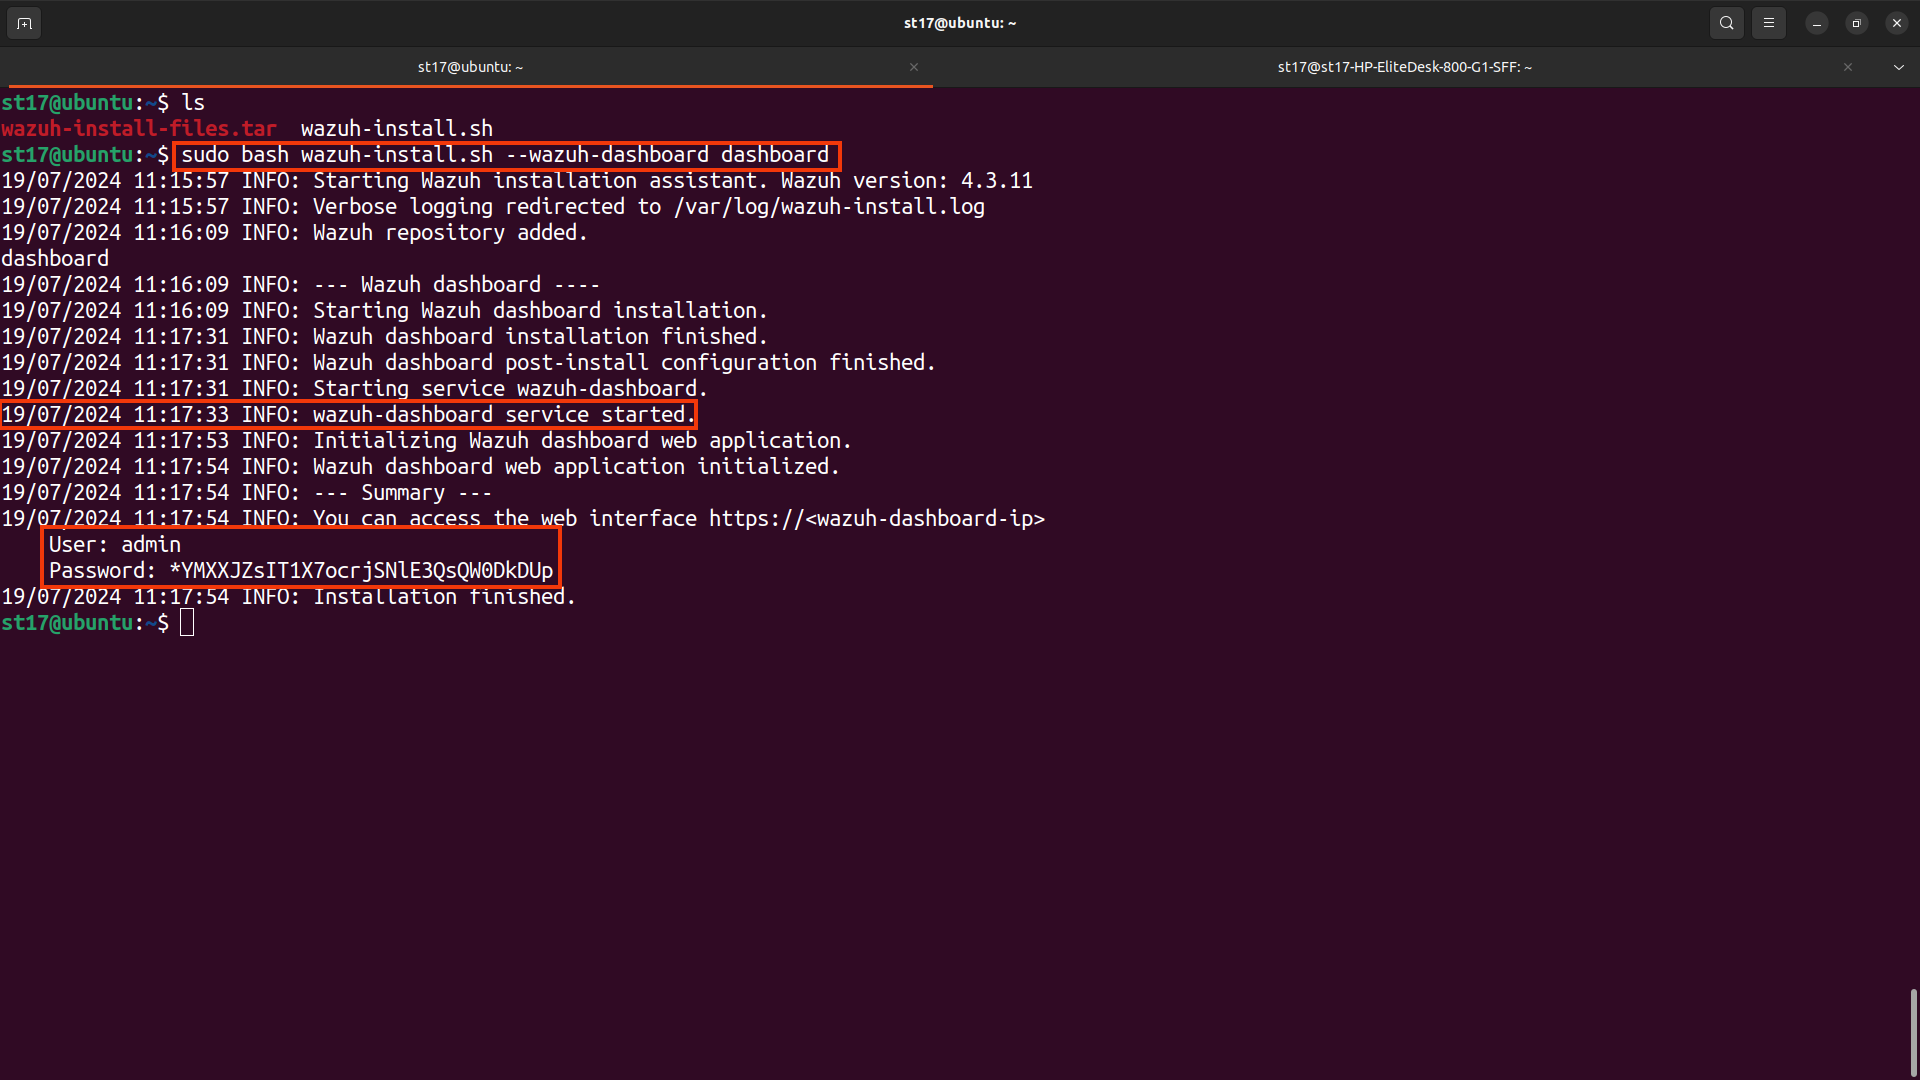 💡Our system does not comply with recommended considerations, which is why we use the -i option to ignore unnecessary checks.
Once the assistant finishes the installation, the output shows the access credentials and a message that confirms that the installation was successful.
INFO: --- Summary ---
INFO: You can access the web interface https://<wazuh-dashboard-ip>
   User: admin
   Password: <ADMIN_PASSWORD>

INFO: Installation finished.
You now have installed and configured Wazuh. All passwords generated by the Wazuh installation assistant can be found in the
wazuh-passwords.txtfile inside thewazuh-install-files.tararchive. To print them, run the following command:tar -O -xvf wazuh-install-files.tar wazuh-install-files/wazuh-passwords.txt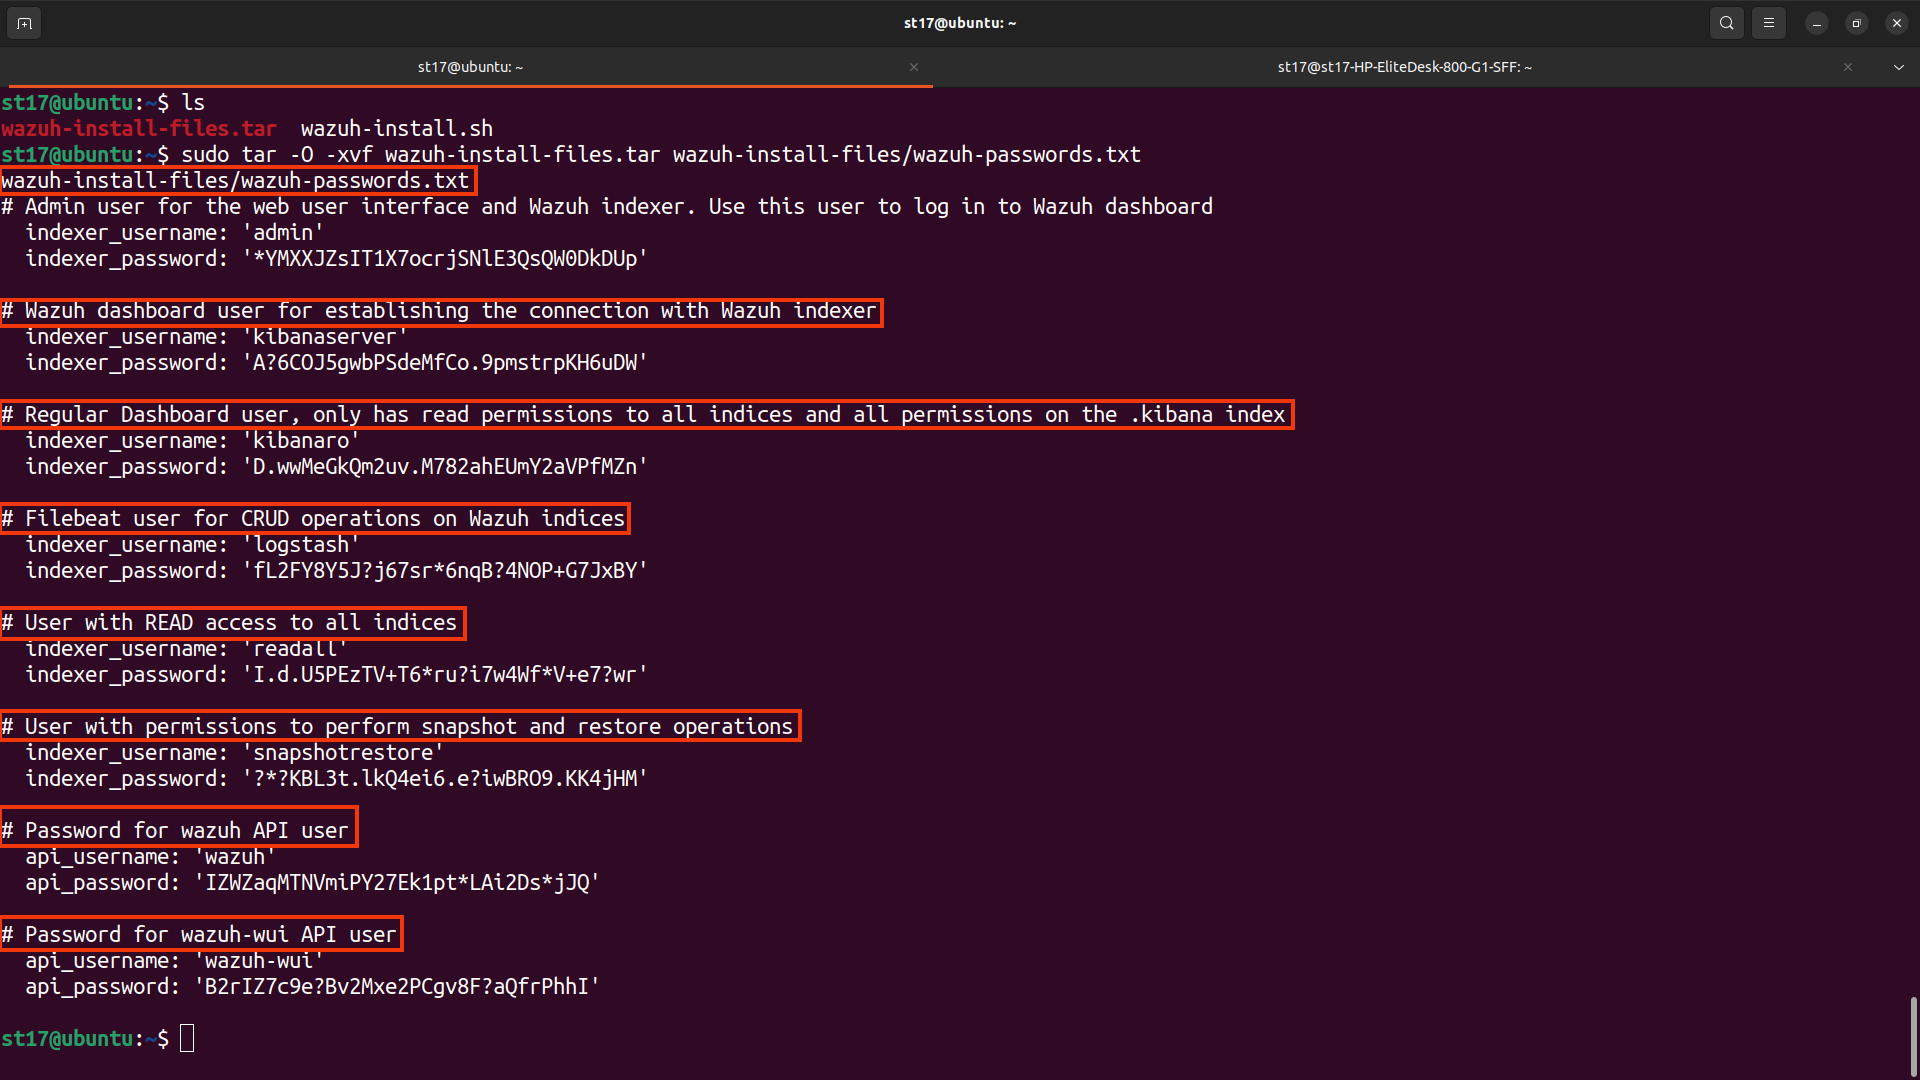
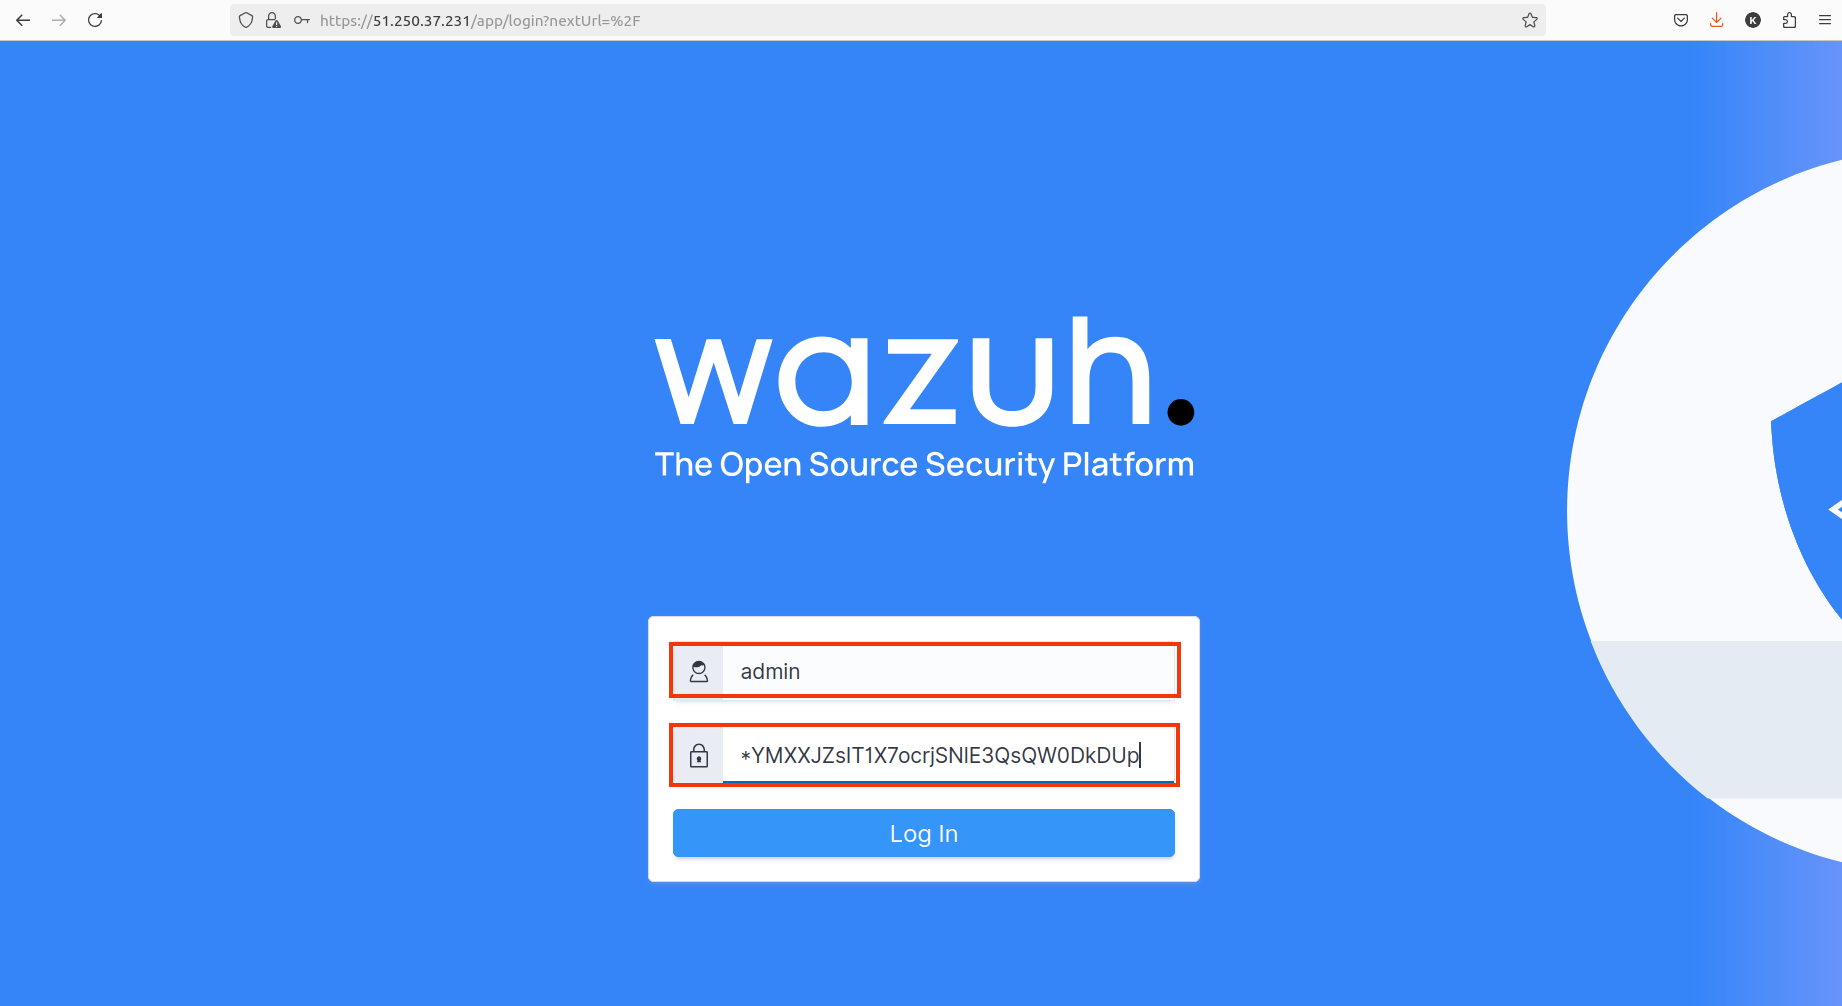
- Access the Wazuh web interface with your credentials.
- URL: https://<wazuh-dashboard-ip>
- Username: admin
- Password: <ADMIN_PASSWORD>
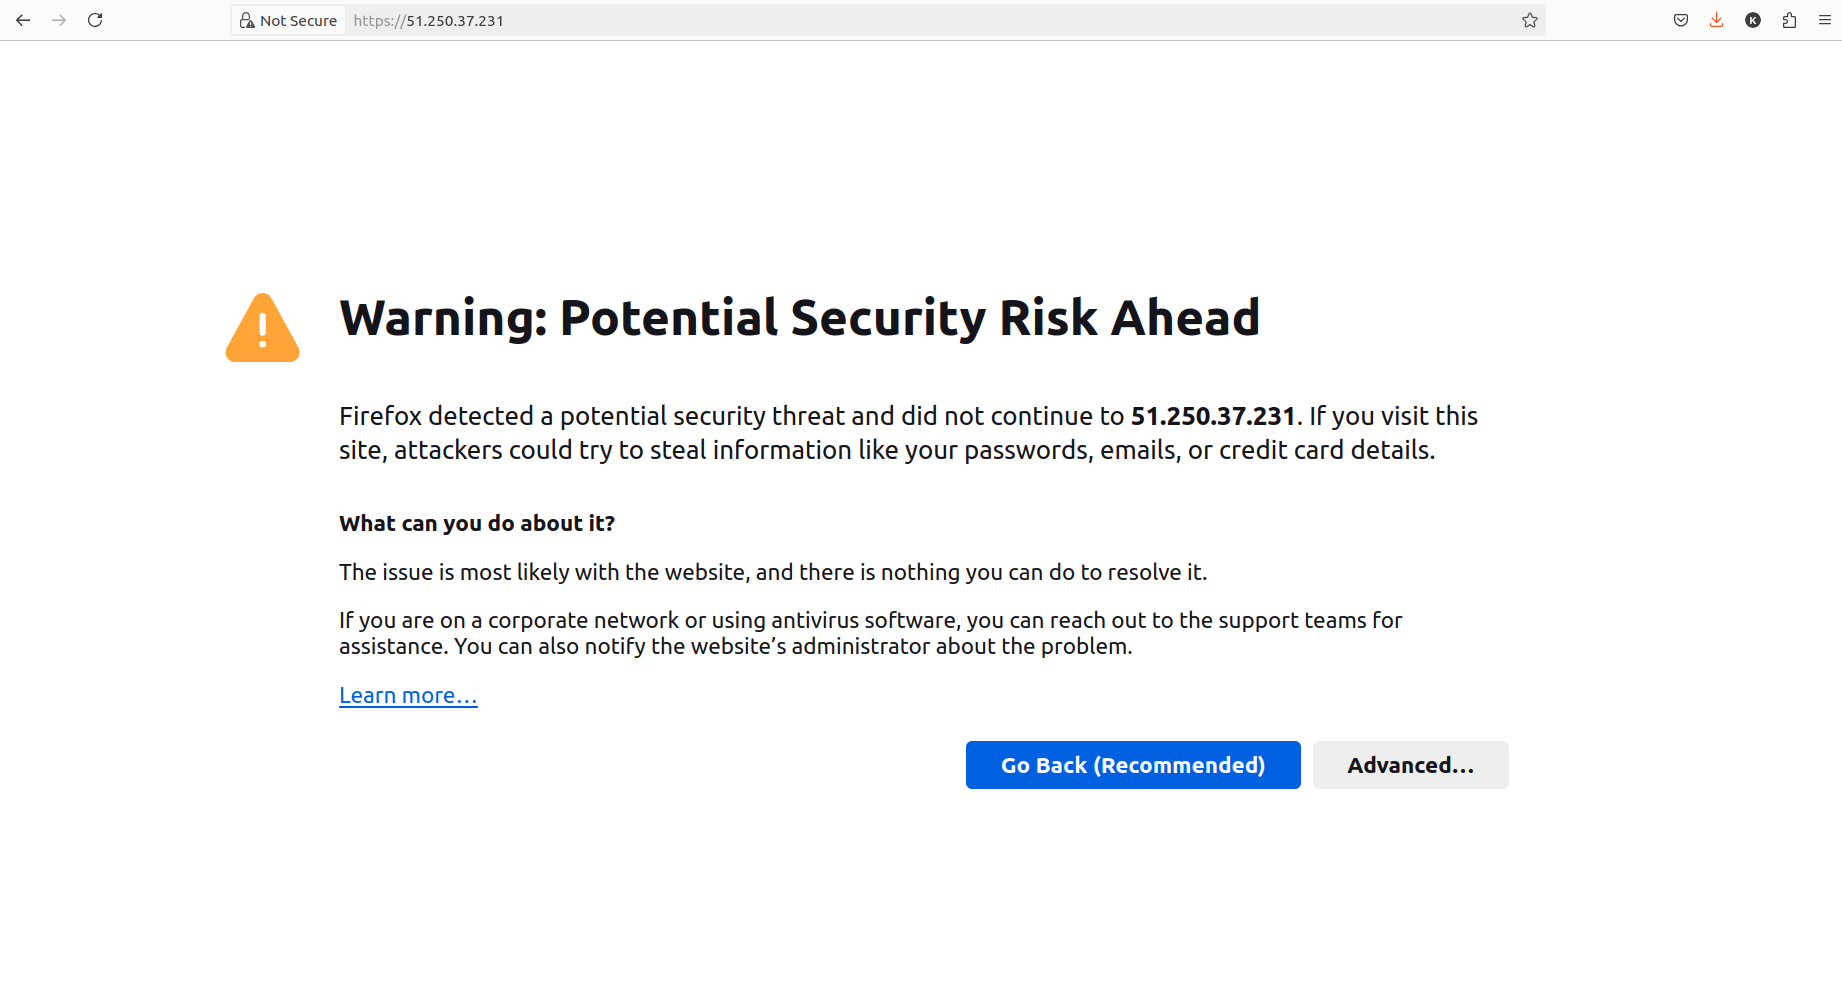
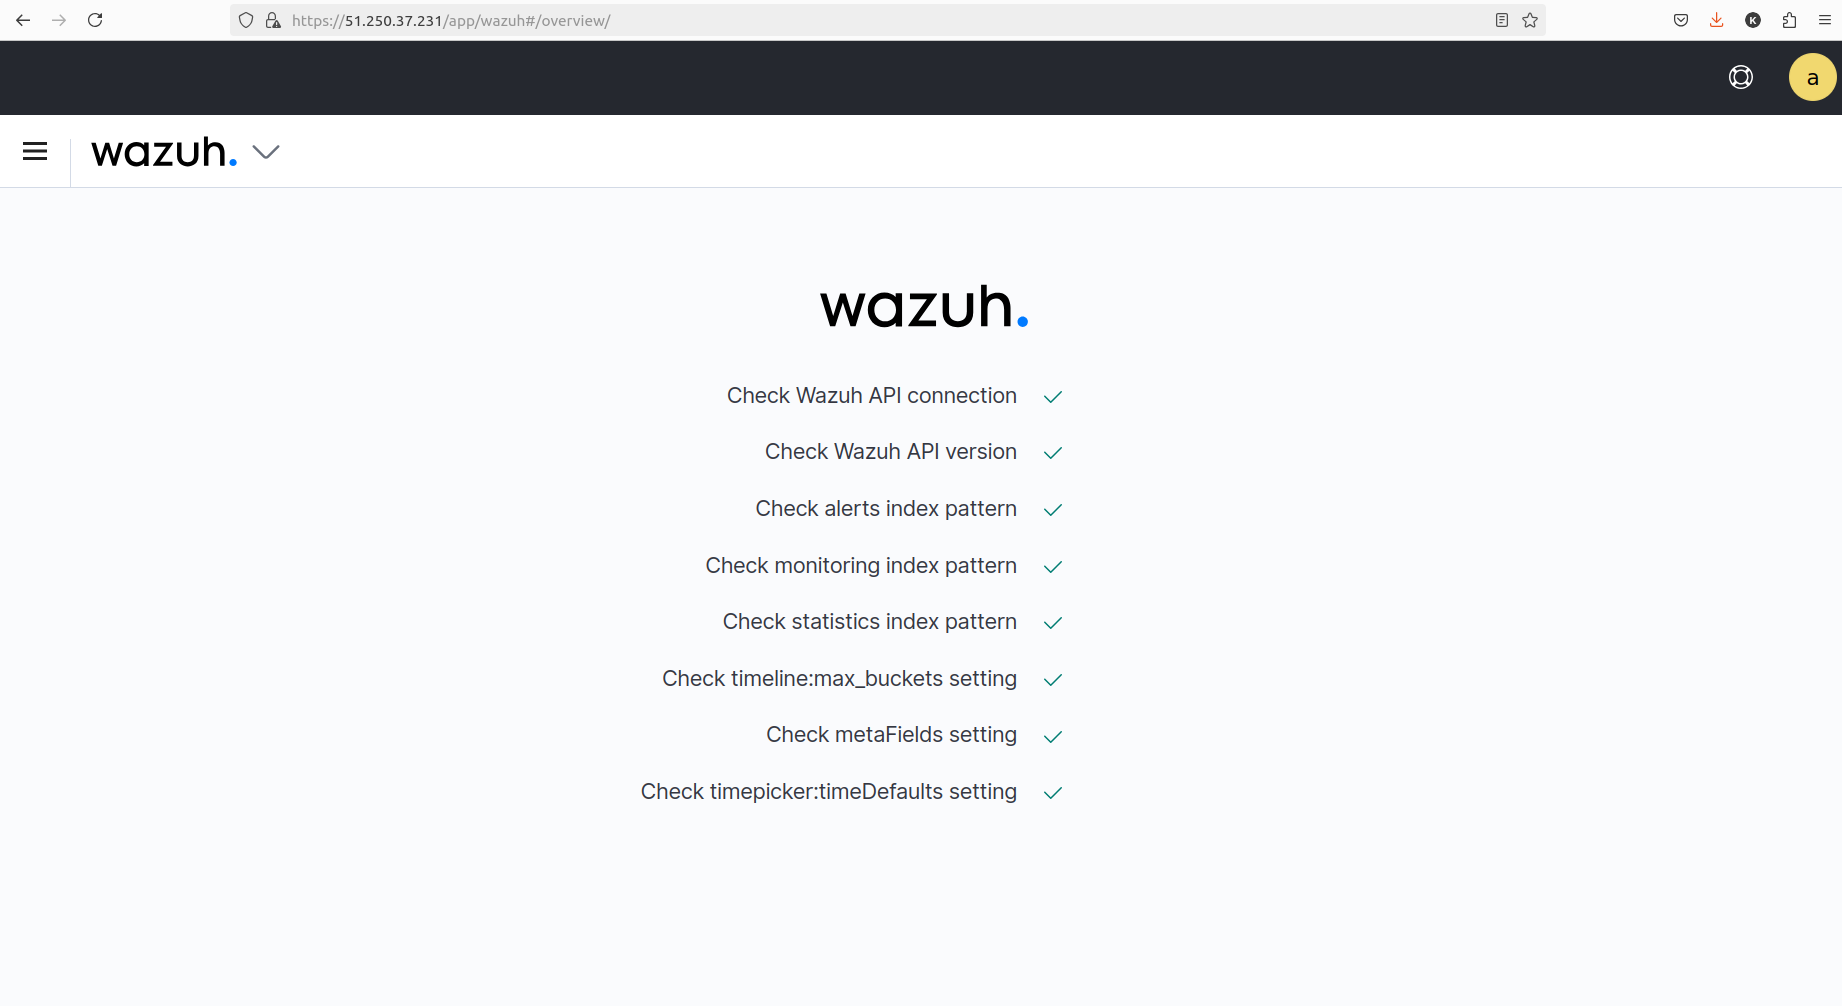
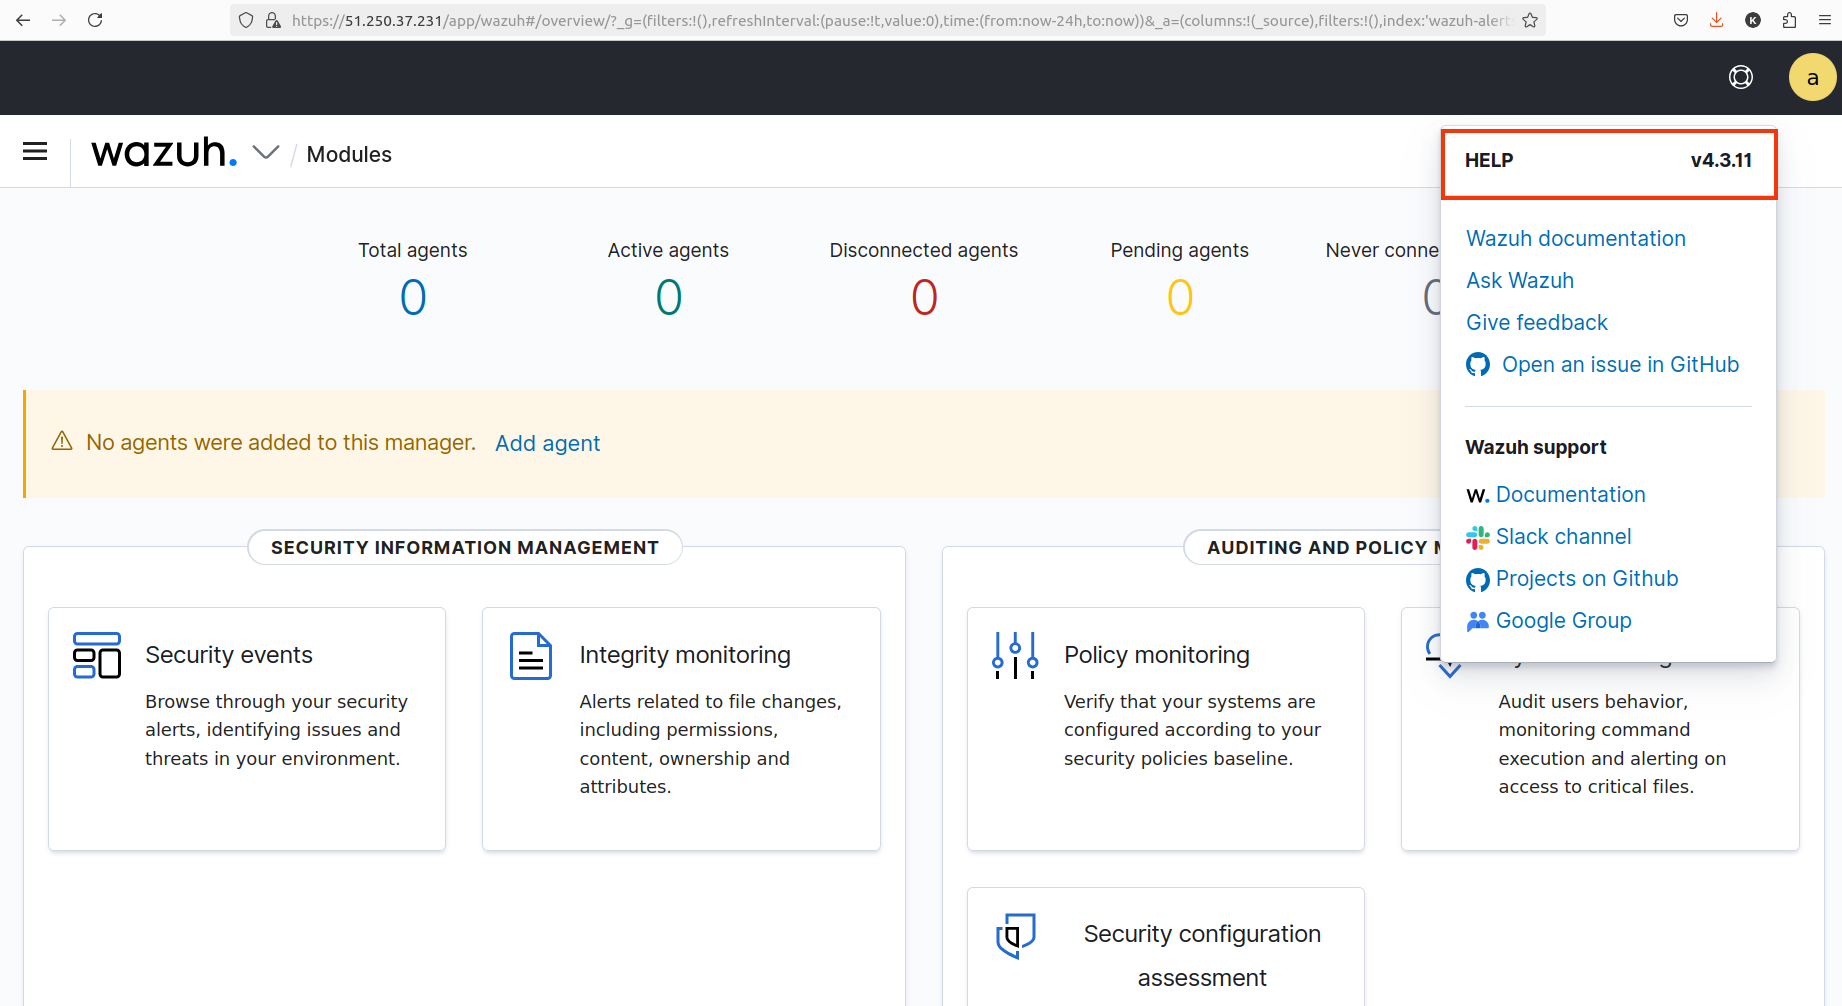
When you access the Wazuh dashboard for the first time, the browser shows a warning message stating that the certificate was not issued by a trusted authority. An exception can be added in the advanced options of the web browser. For increased security, the
root-ca.pemfile previously generated can be imported to the certificate manager of the browser instead. Alternatively, a certificate from a trusted authority can be configured.
1.4.3 Wazuh Cloud
Wazuh Cloud is a cloud-based security monitoring solution that provides organizations with a comprehensive approach to security information and event management (SIEM) and extended detection and response (XDR). Below are the key details about Wazuh Cloud:
Wazuh Cloud enables organizations to monitor their IT infrastructure, including on-premises, cloud, and hybrid environments, by leveraging the capabilities of the Wazuh platform. It provides a centralized view of security events and incidents, allowing for real-time analysis and response.
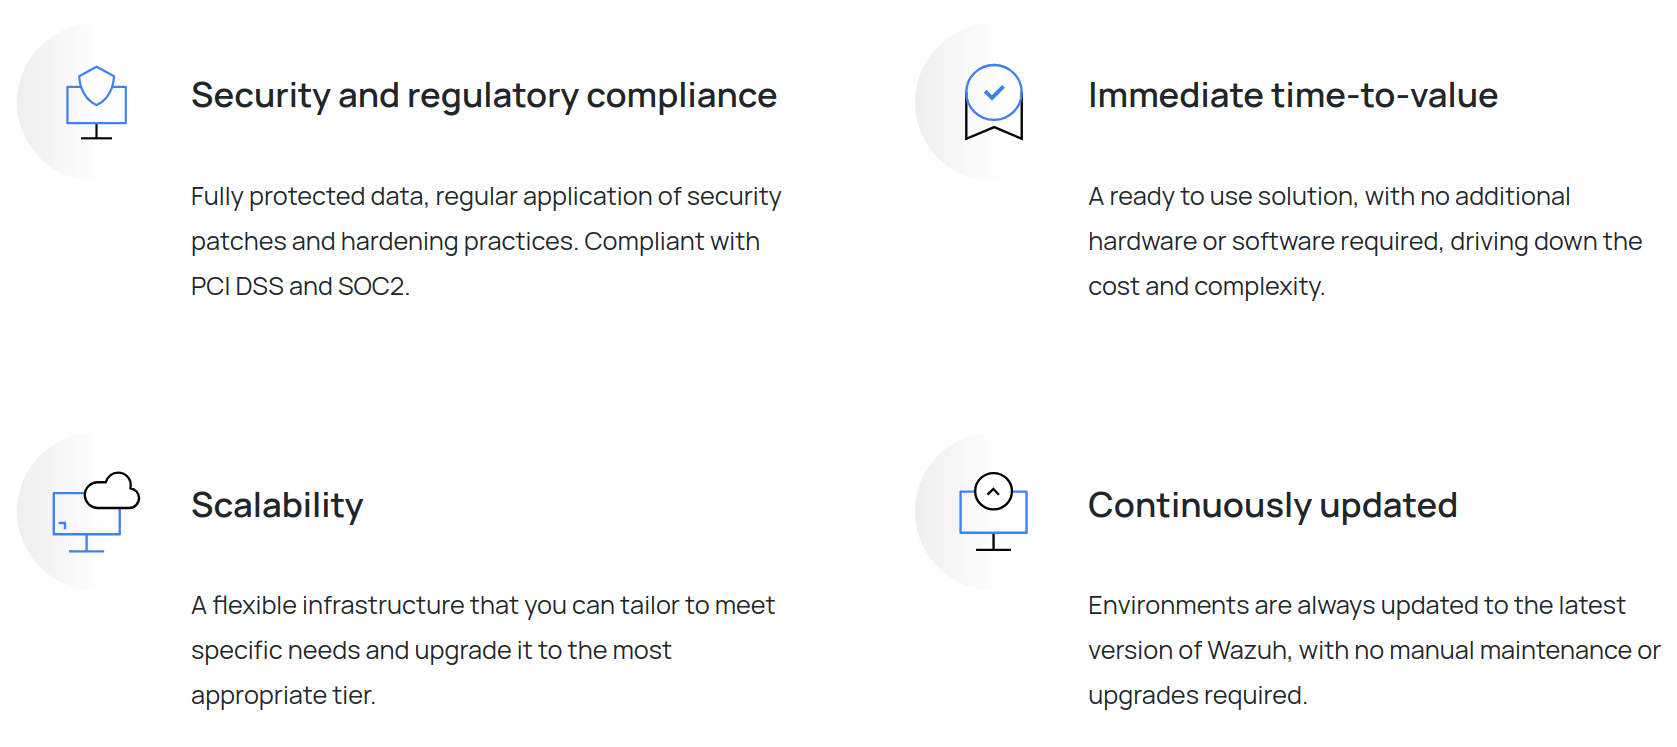
Key Features
- Centralized Management:
- Wazuh Cloud allows for the centralized management of security events from multiple sources, including servers, workstations, and cloud services.
- Real-time Monitoring:
- The platform provides real-time monitoring of security events, enabling organizations to detect threats and anomalies as they occur.
- Scalability:
- Wazuh Cloud is designed to scale with the organization's needs, allowing for the addition of new agents and resources without significant overhead.
- Compliance Management:
- Wazuh Cloud helps organizations meet compliance requirements by providing tools for auditing and reporting on security events.
- Integration with Cloud Providers:
- The solution supports integrations with major cloud service providers, allowing for seamless monitoring of cloud resources.
- Threat Intelligence:
- Wazuh Cloud incorporates threat intelligence feeds to enhance the detection capabilities and provide context around security events.
Trial Offer
The trial lasts for 14 days, allowing organizations to explore the features and capabilities of Wazuh Cloud without any commitment.

During the trial, users can access all the functionalities of Wazuh Cloud, including agent management, alerting, reporting, and compliance features.
After the trial period, organizations can choose from several pricing plans based on their requirements:
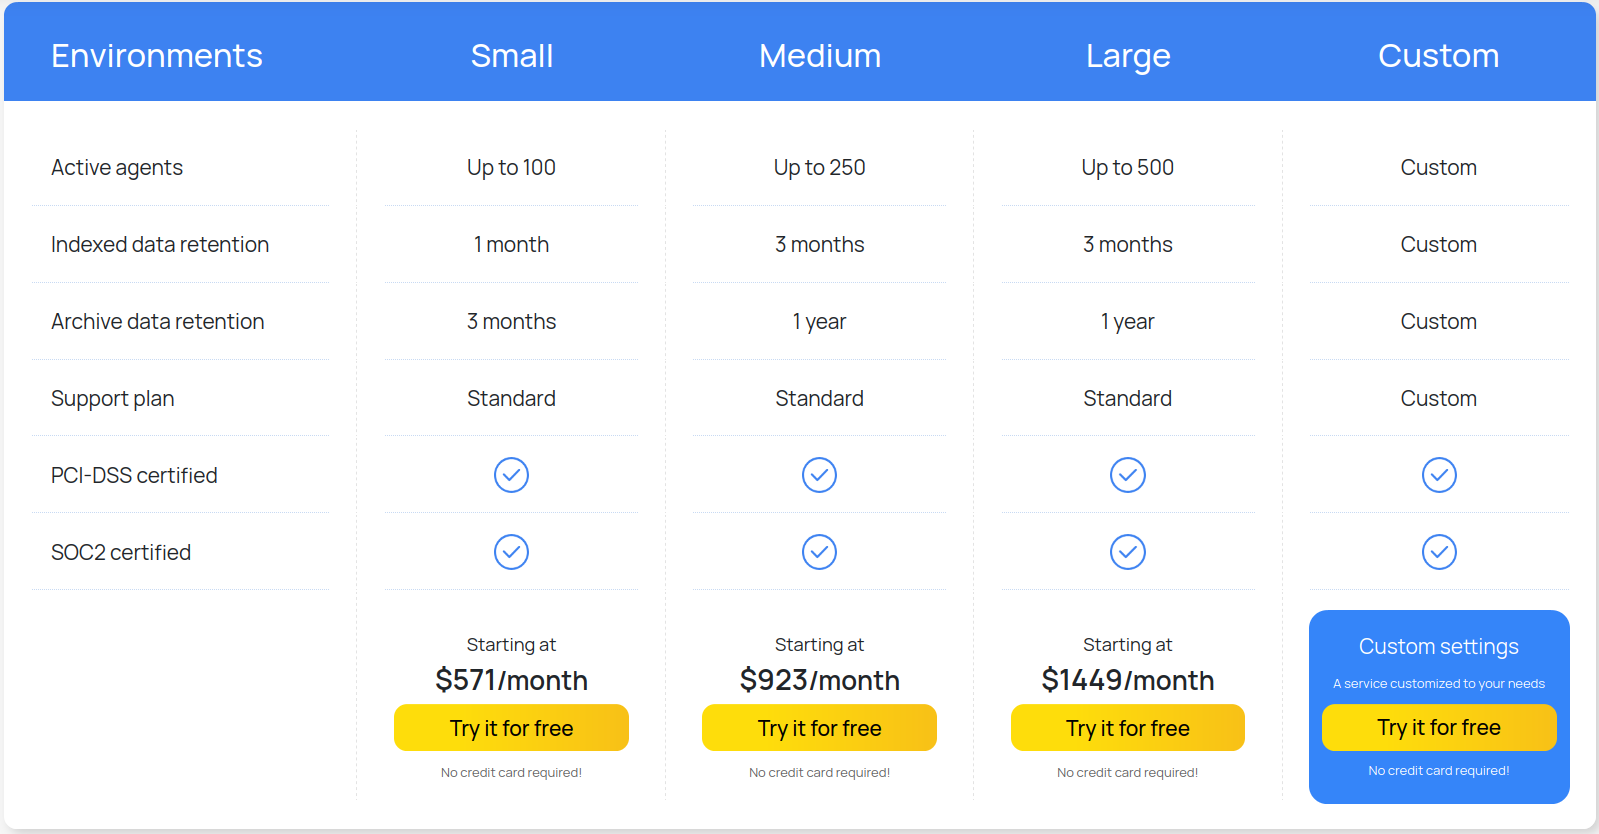
Wazuh Cloud is a valuable tool for organizations looking to enhance their security posture. For more information or to sign up for the trial, you can visit the official Wazuh website.
2. Configuring Wazuh SIEM
2.1 Configuring Wazuh to Monitor Docker Containers
To effectively monitor Docker containers using Wazuh, you need to configure both the Wazuh Manager and the Wazuh Agent. This section provides a step-by-step guide on how to set up Wazuh to collect logs from Docker containers, including installing and configuring the Wazuh Agent.
2.1.1 Installing Wazuh Agent on Docker Host
You can install the Wazuh agent on the Docker host (the machine where your Docker containers are running) in two primary ways: manually or through the Wazuh UI. Below, I’ll outline both methods for installing the Wazuh agent.
- Add Wazuh Repository and Install Agent:
- First, add the Wazuh repository and install the Wazuh Agent on the host where Docker is running.
curl -s https://packages.wazuh.com/key/GPG-KEY-WAZUH | gpg --no-default-keyring --keyring gnupg-ring:/usr/share/keyrings/wazuh.gpg --import && chmod 644 /usr/share/keyrings/wazuh.gpg echo "deb [signed-by=/usr/share/keyrings/wazuh.gpg] https://packages.wazuh.com/4.x/apt/ stable main" | tee -a /etc/apt/sources.list.d/wazuh.list apt-get update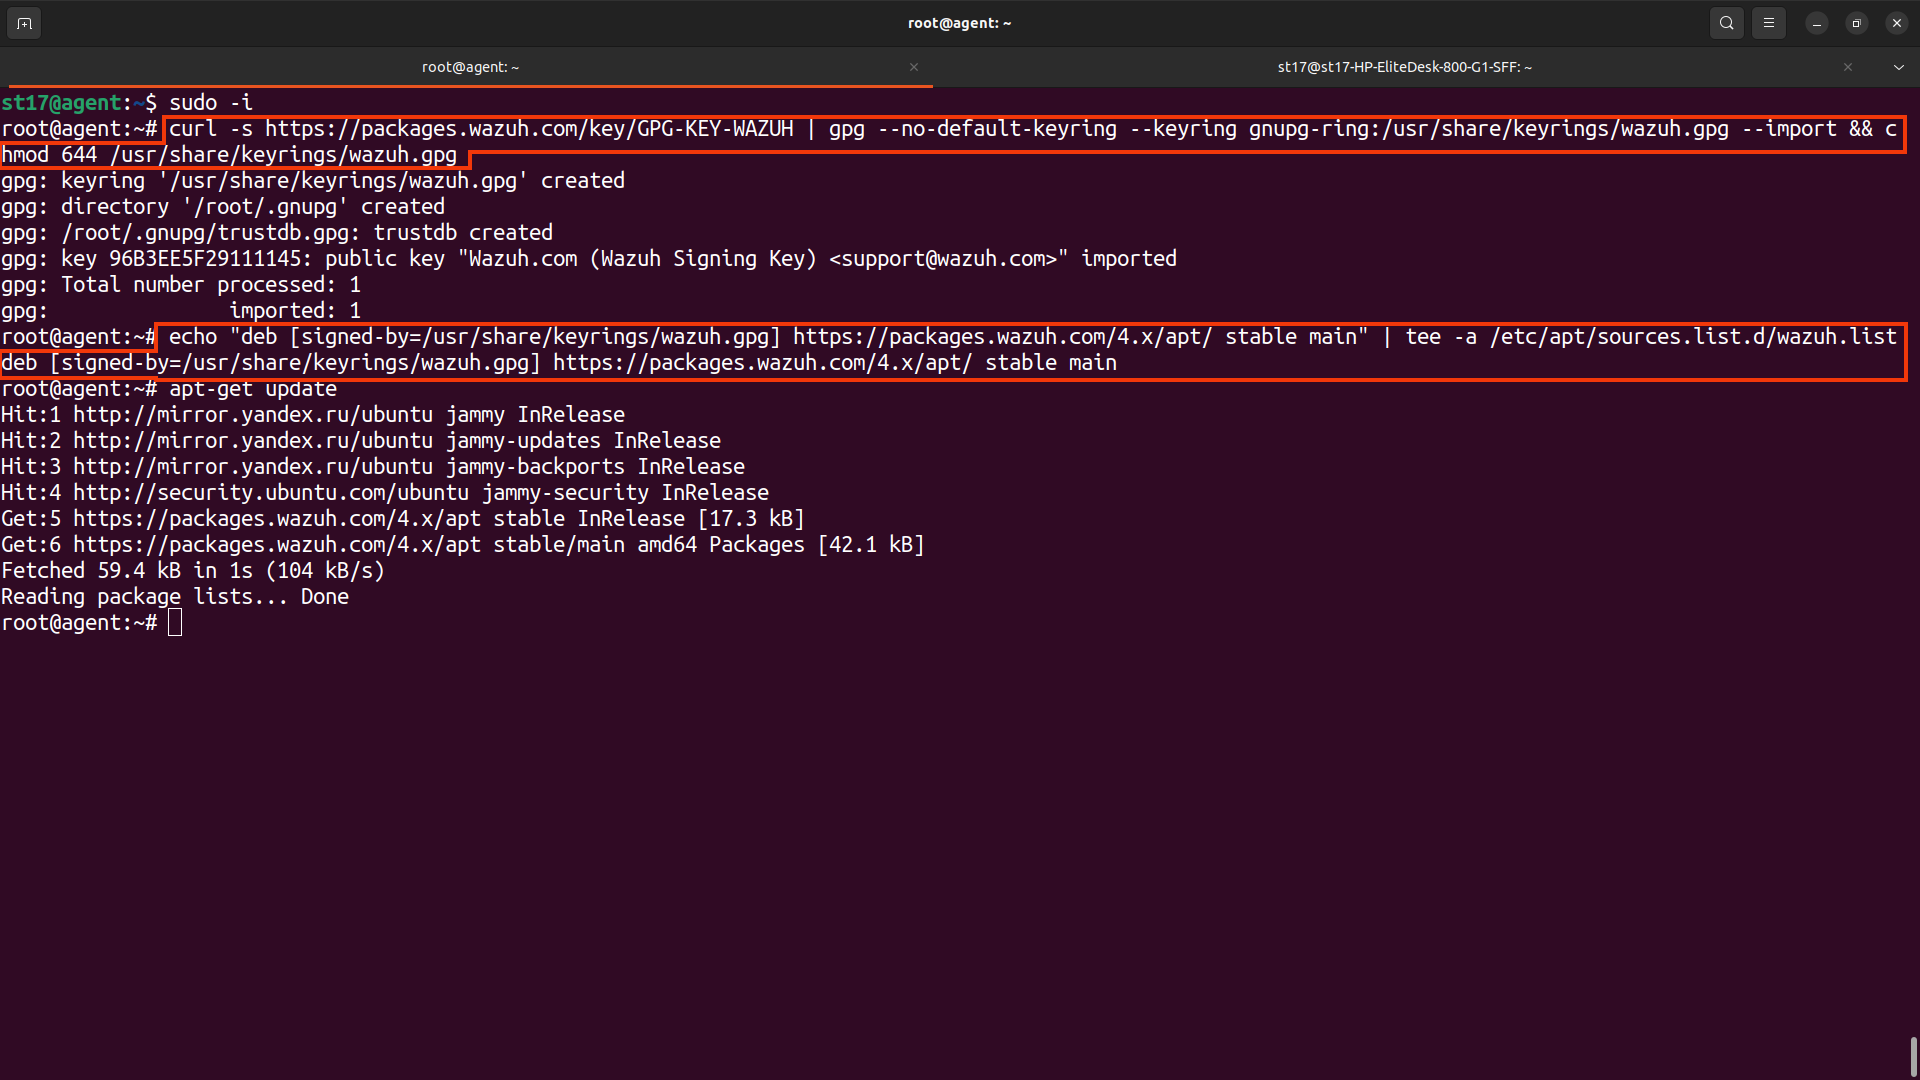 💡For Debian 7, 8, and Ubuntu 14 systems import the GCP key and add the Wazuh repository (steps 1 and 2) using the following commands.
apt-get install gnupg apt-transport-https curl -s https://packages.wazuh.com/key/GPG-KEY-WAZUH | apt-key add - echo "deb https://packages.wazuh.com/4.x/apt/ stable main" | tee -a /etc/apt/sources.list.d/wazuh.list
- First, add the Wazuh repository and install the Wazuh Agent on the host where Docker is running.
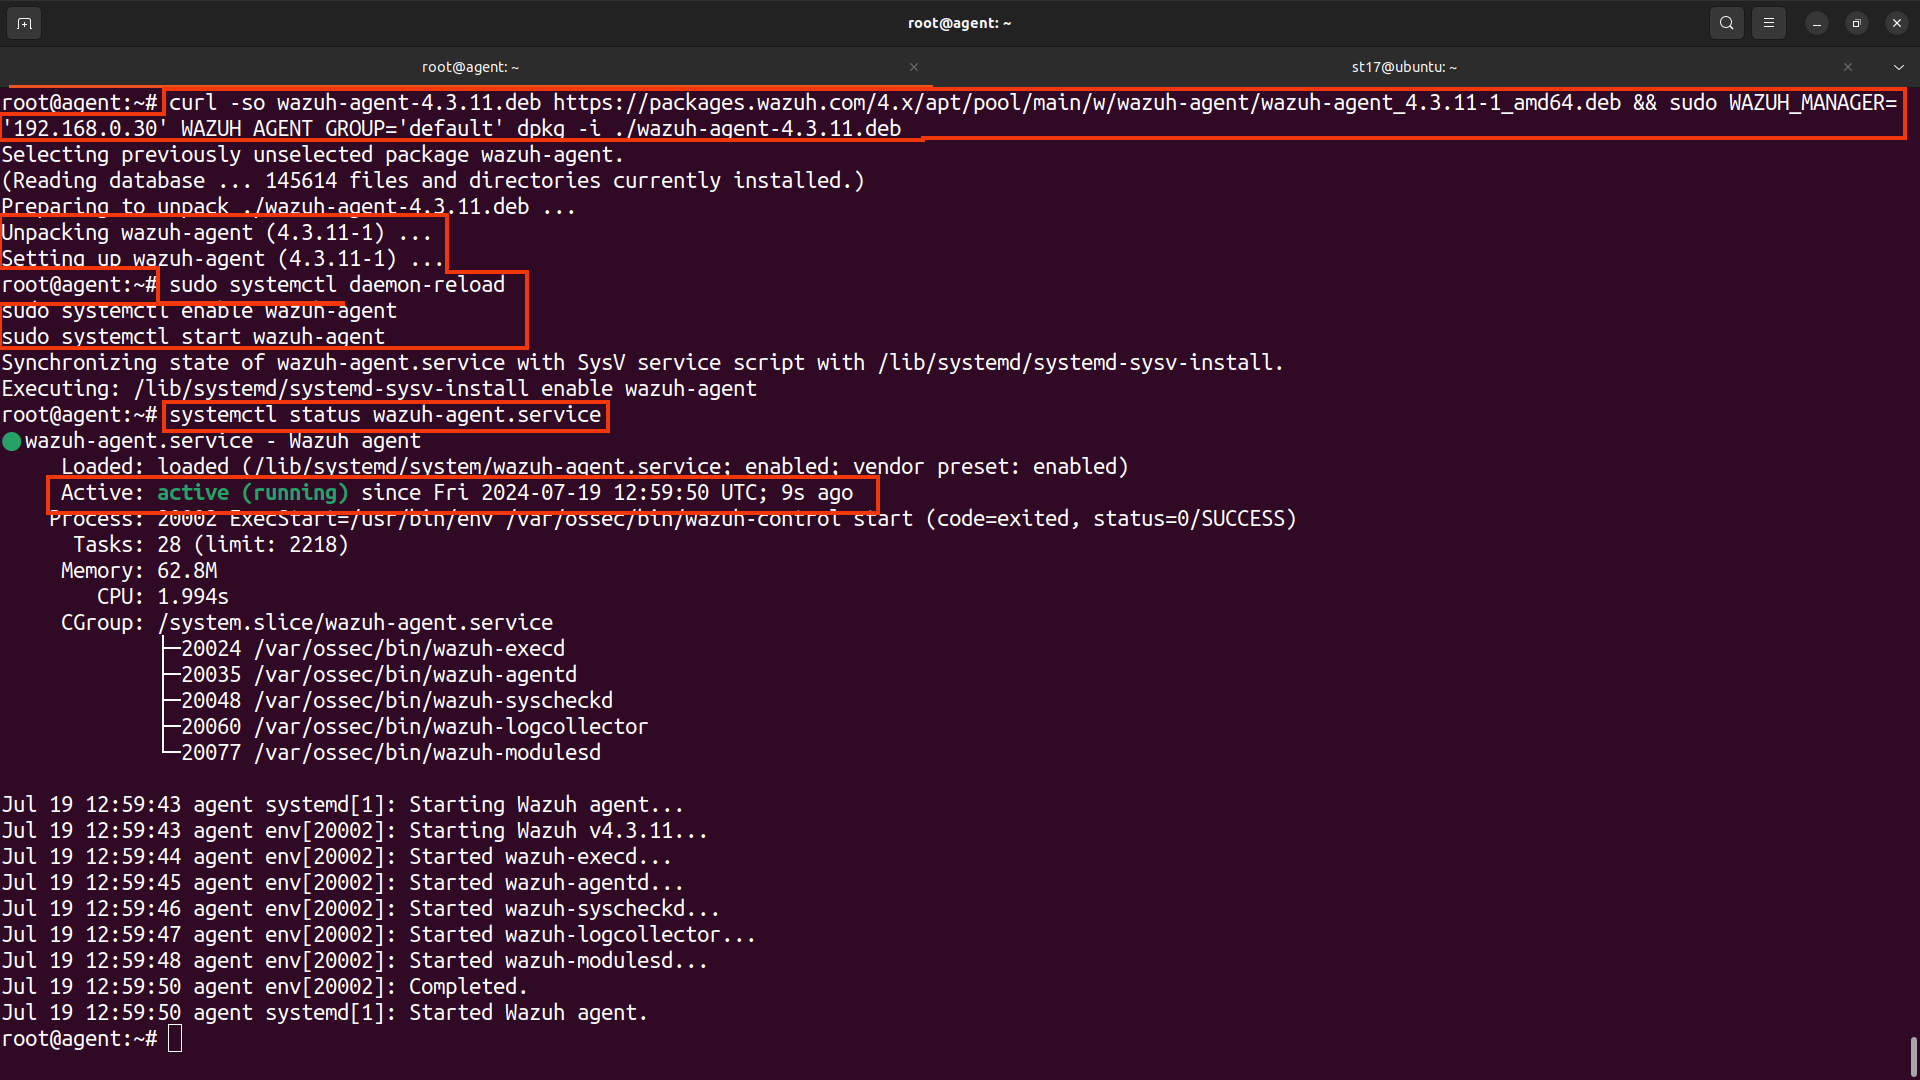
- Deploy a Wazuh agent
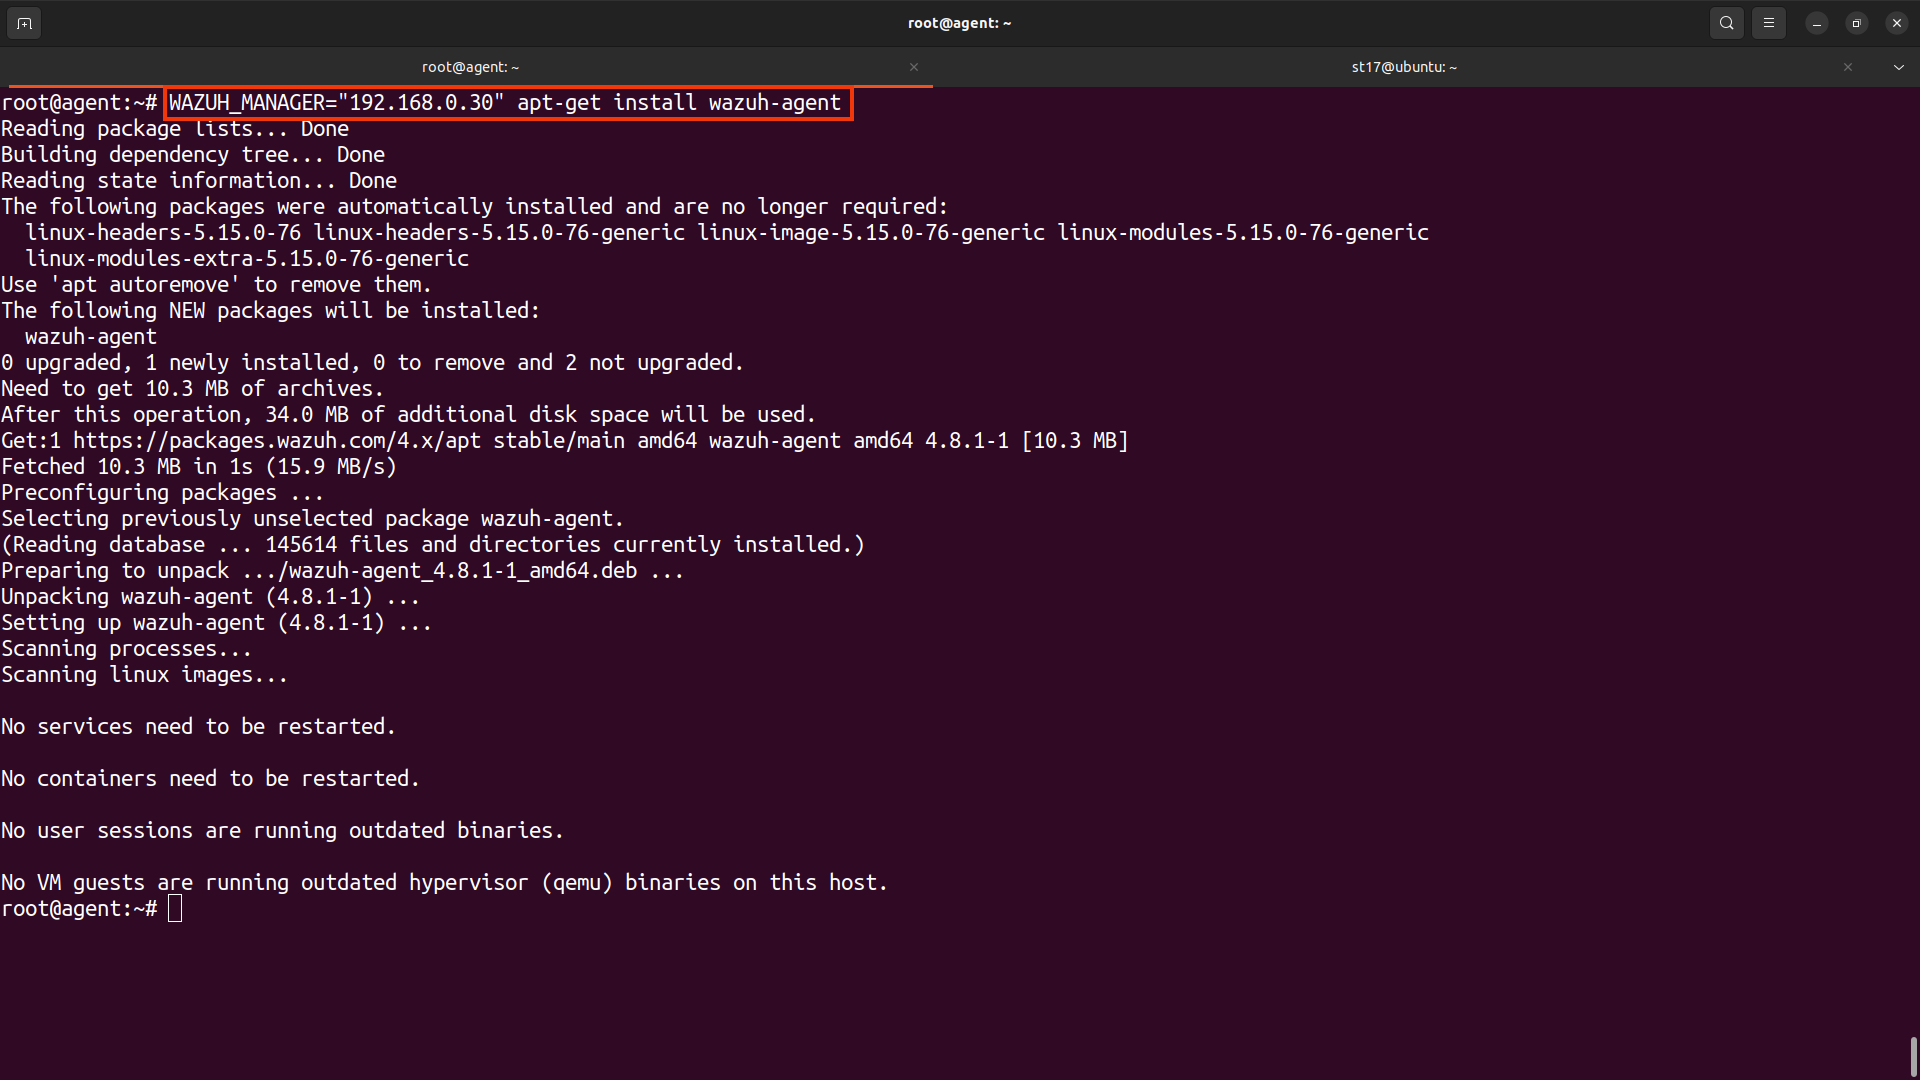
- To deploy the Wazuh agent on your endpoint, select your package manager and edit the
WAZUH_MANAGERvariable to contain your Wazuh manager IP address or hostname.WAZUH_MANAGER="IP_ADDRESS" apt-get install wazuh-agent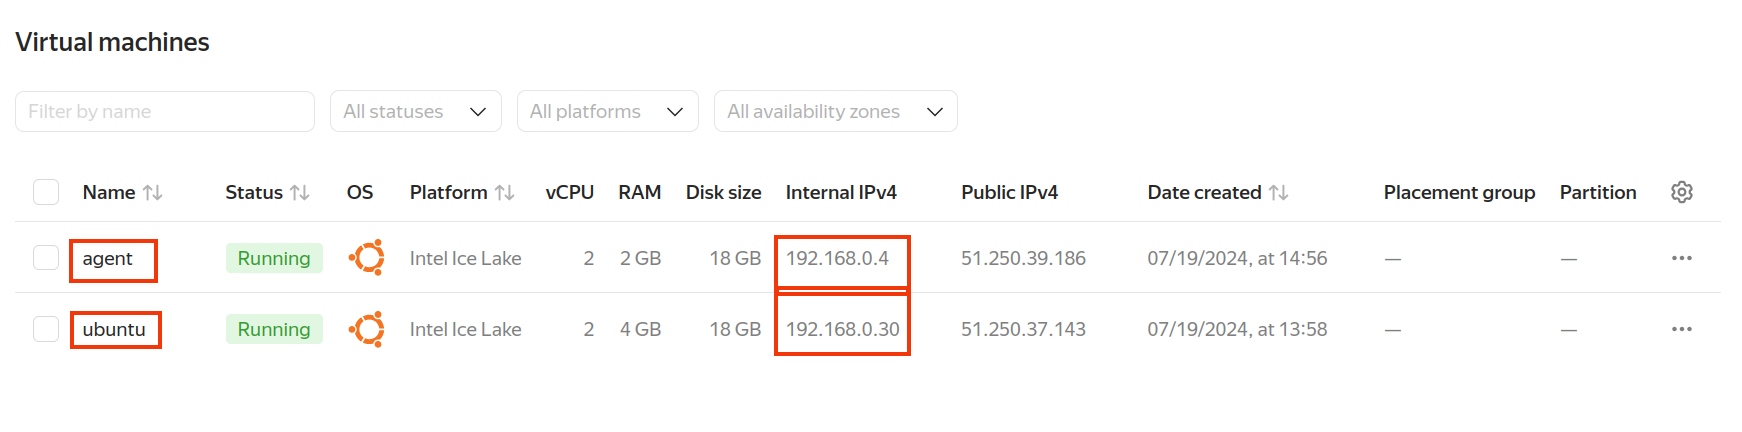
- To deploy the Wazuh agent on your endpoint, select your package manager and edit the
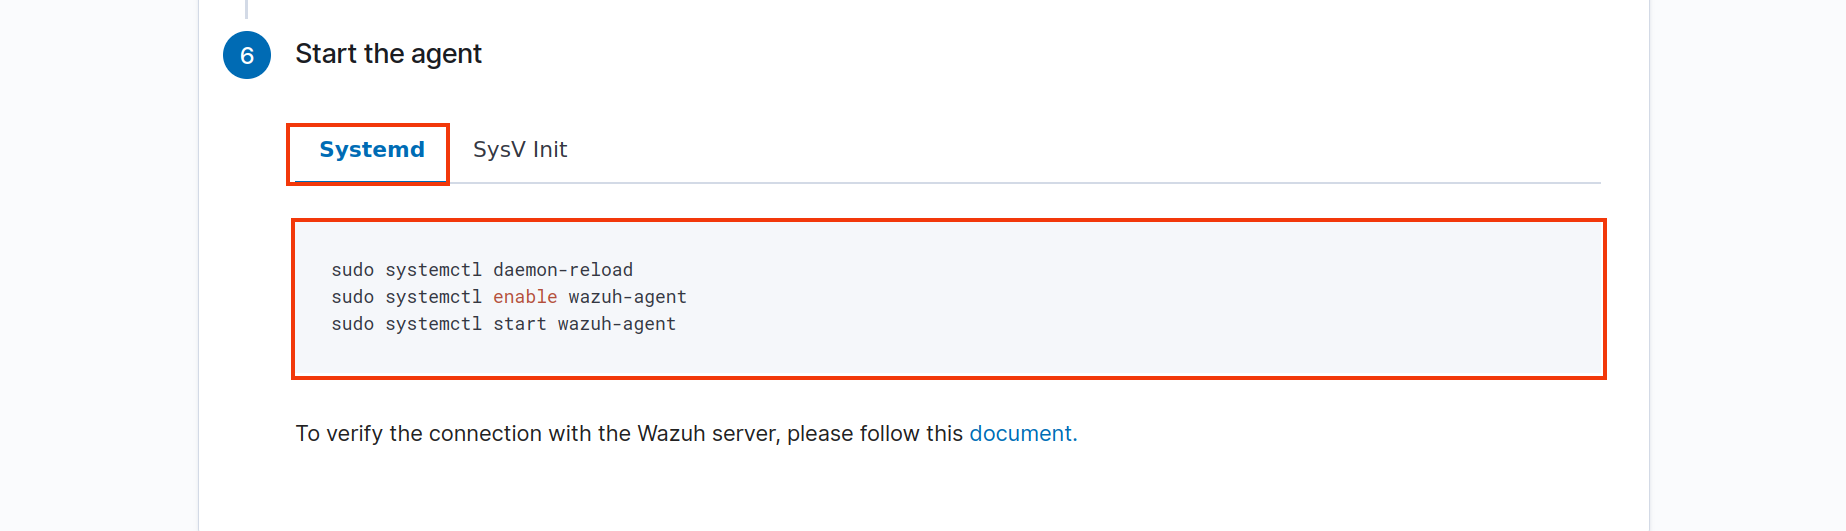
- Enable and start the Wazuh agent service
systemctl daemon-reload
systemctl enable wazuh-agent
systemctl start wazuh-agent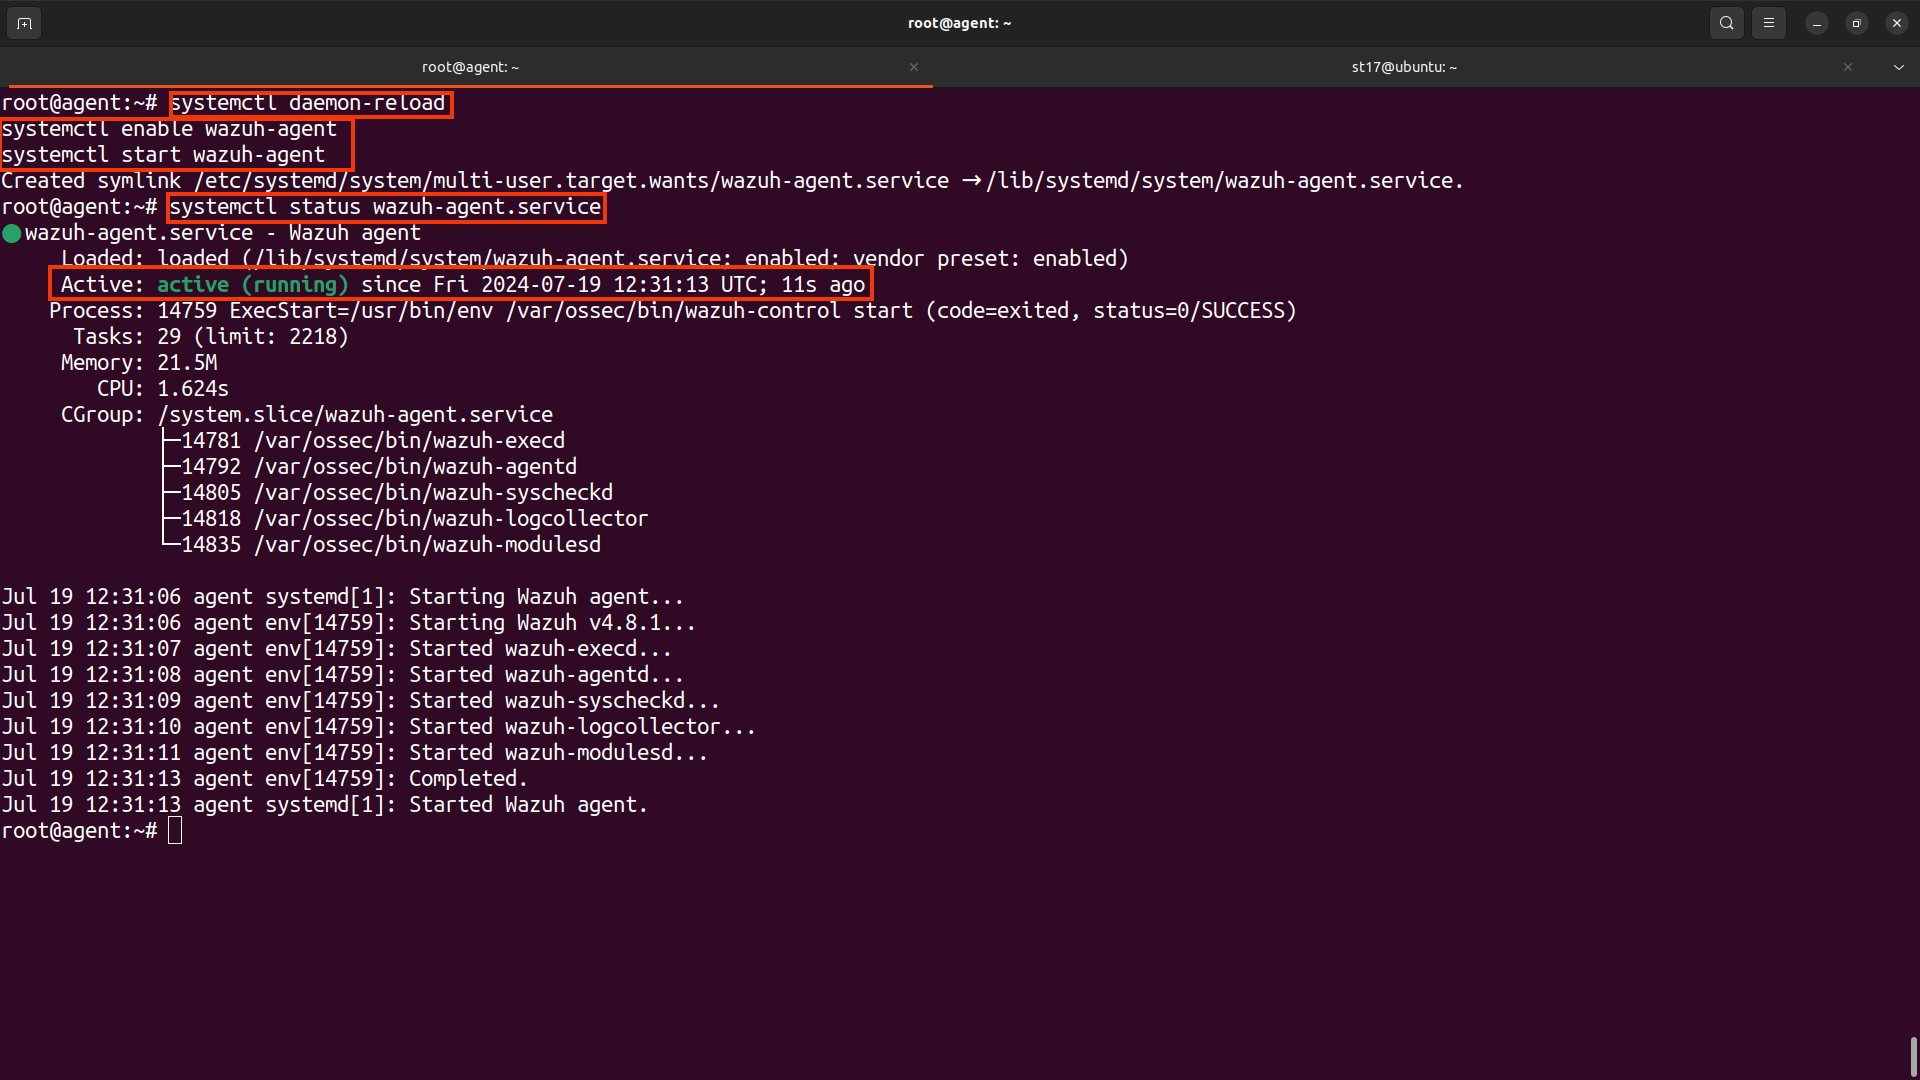
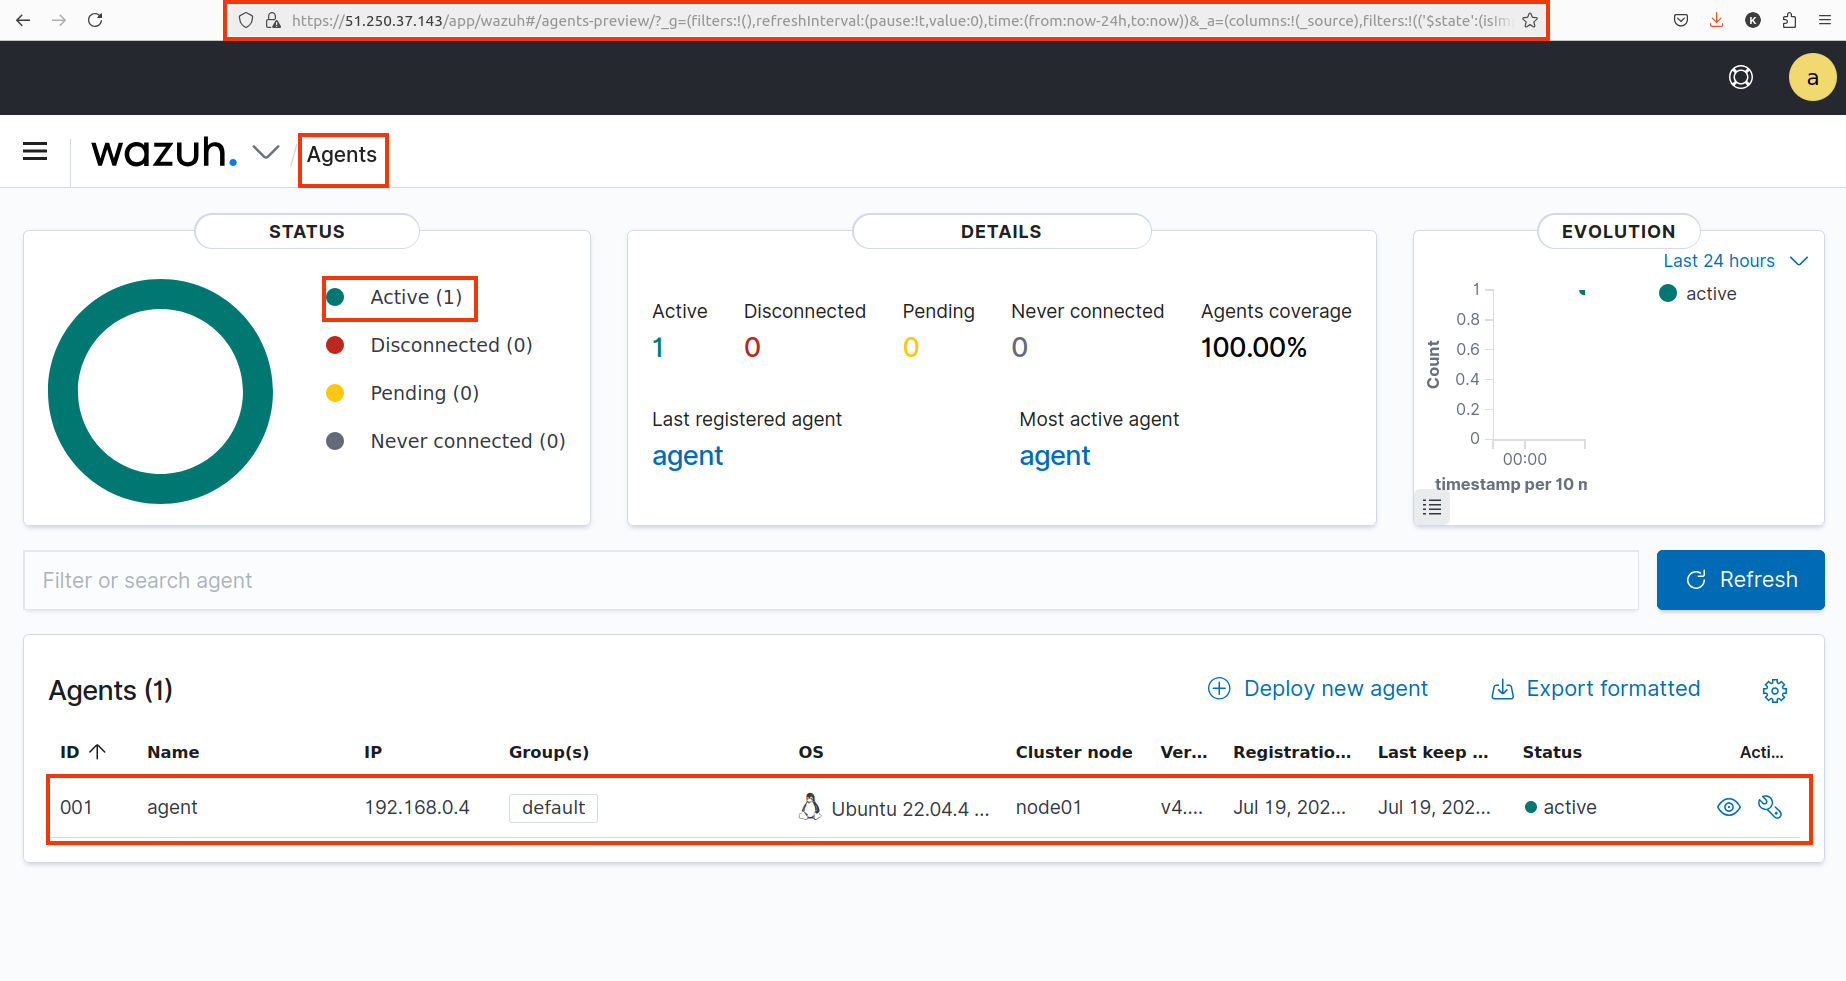
The deployment process is now complete, and the Wazuh agent is successfully running on your Linux system.
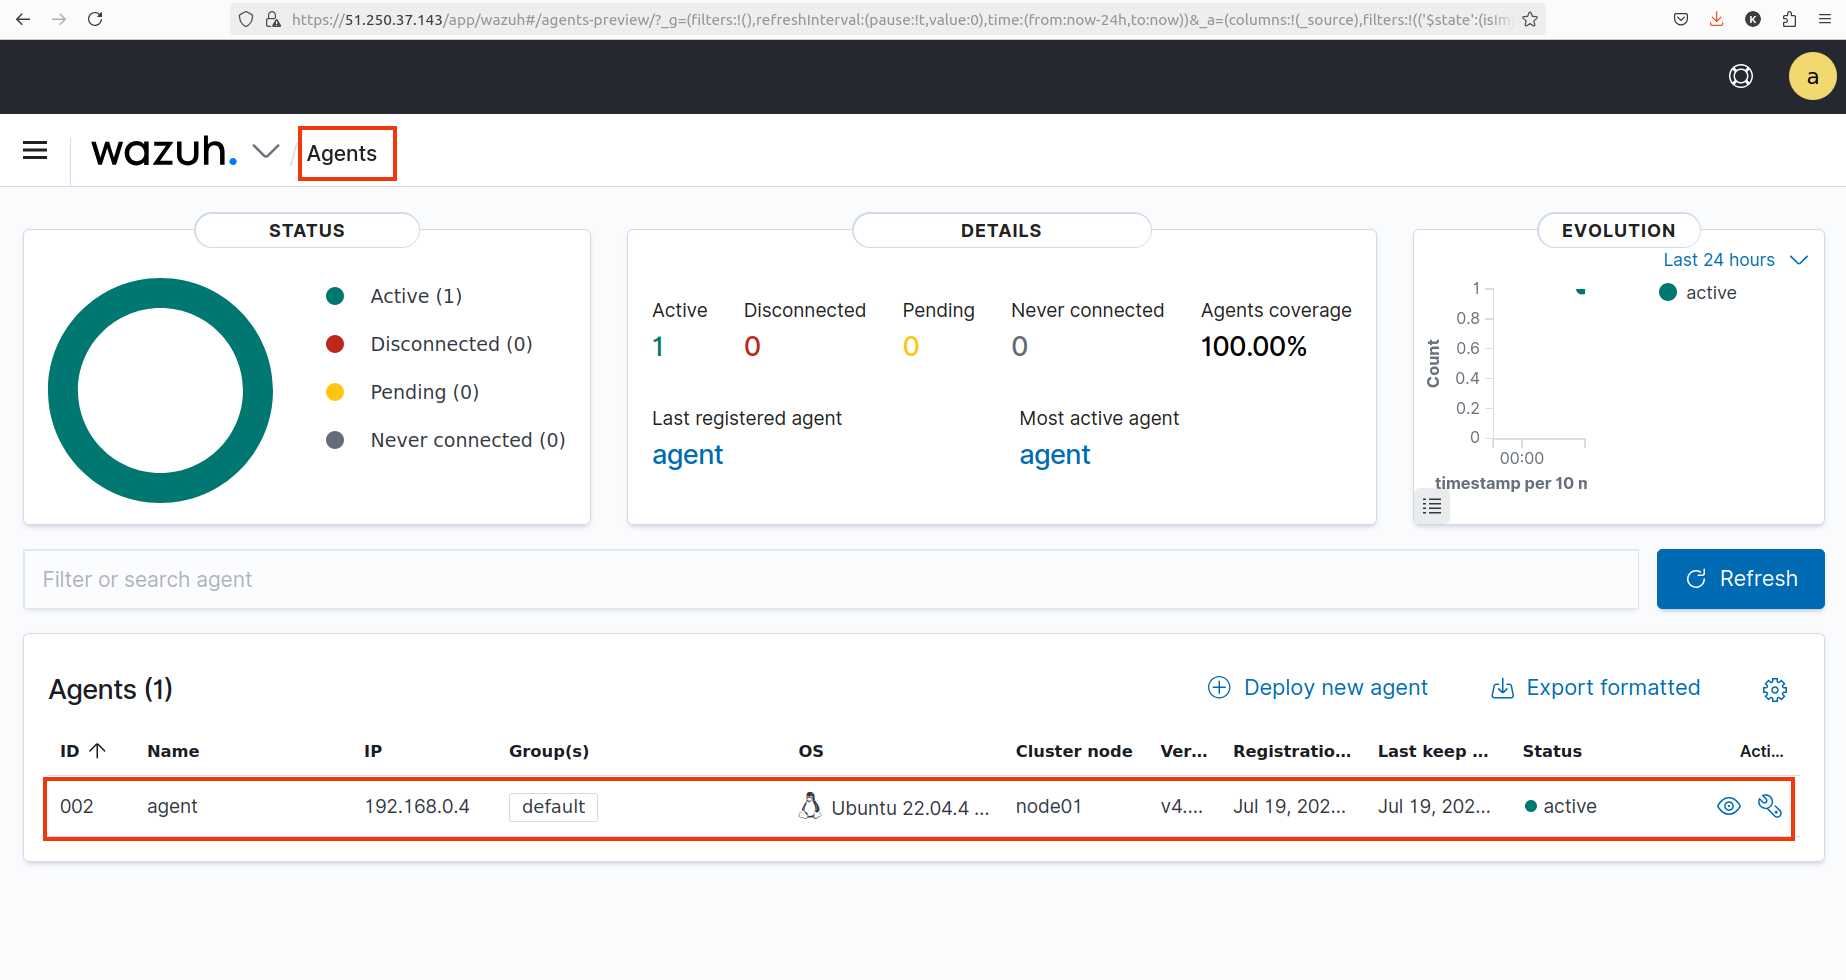
Follow these steps to enroll an agent:
- Log into the Wazuh WUI.
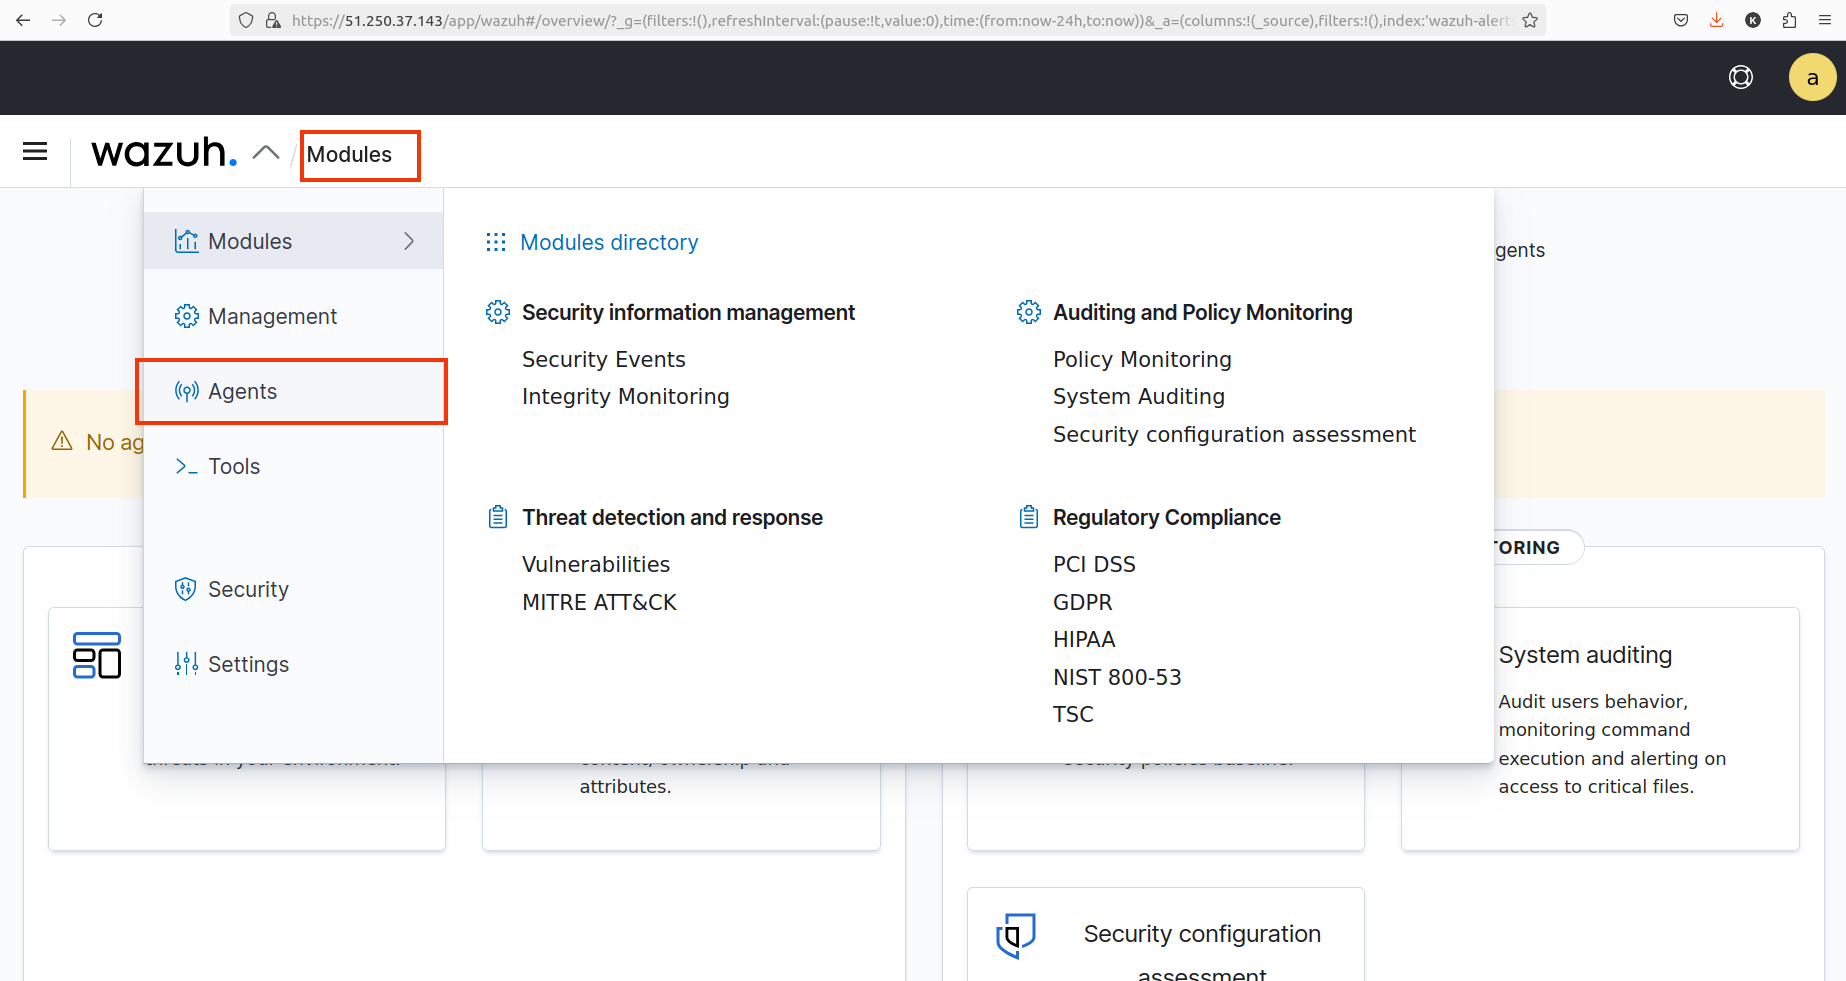
- Click the upper-left Wazuh icon and then Agents.
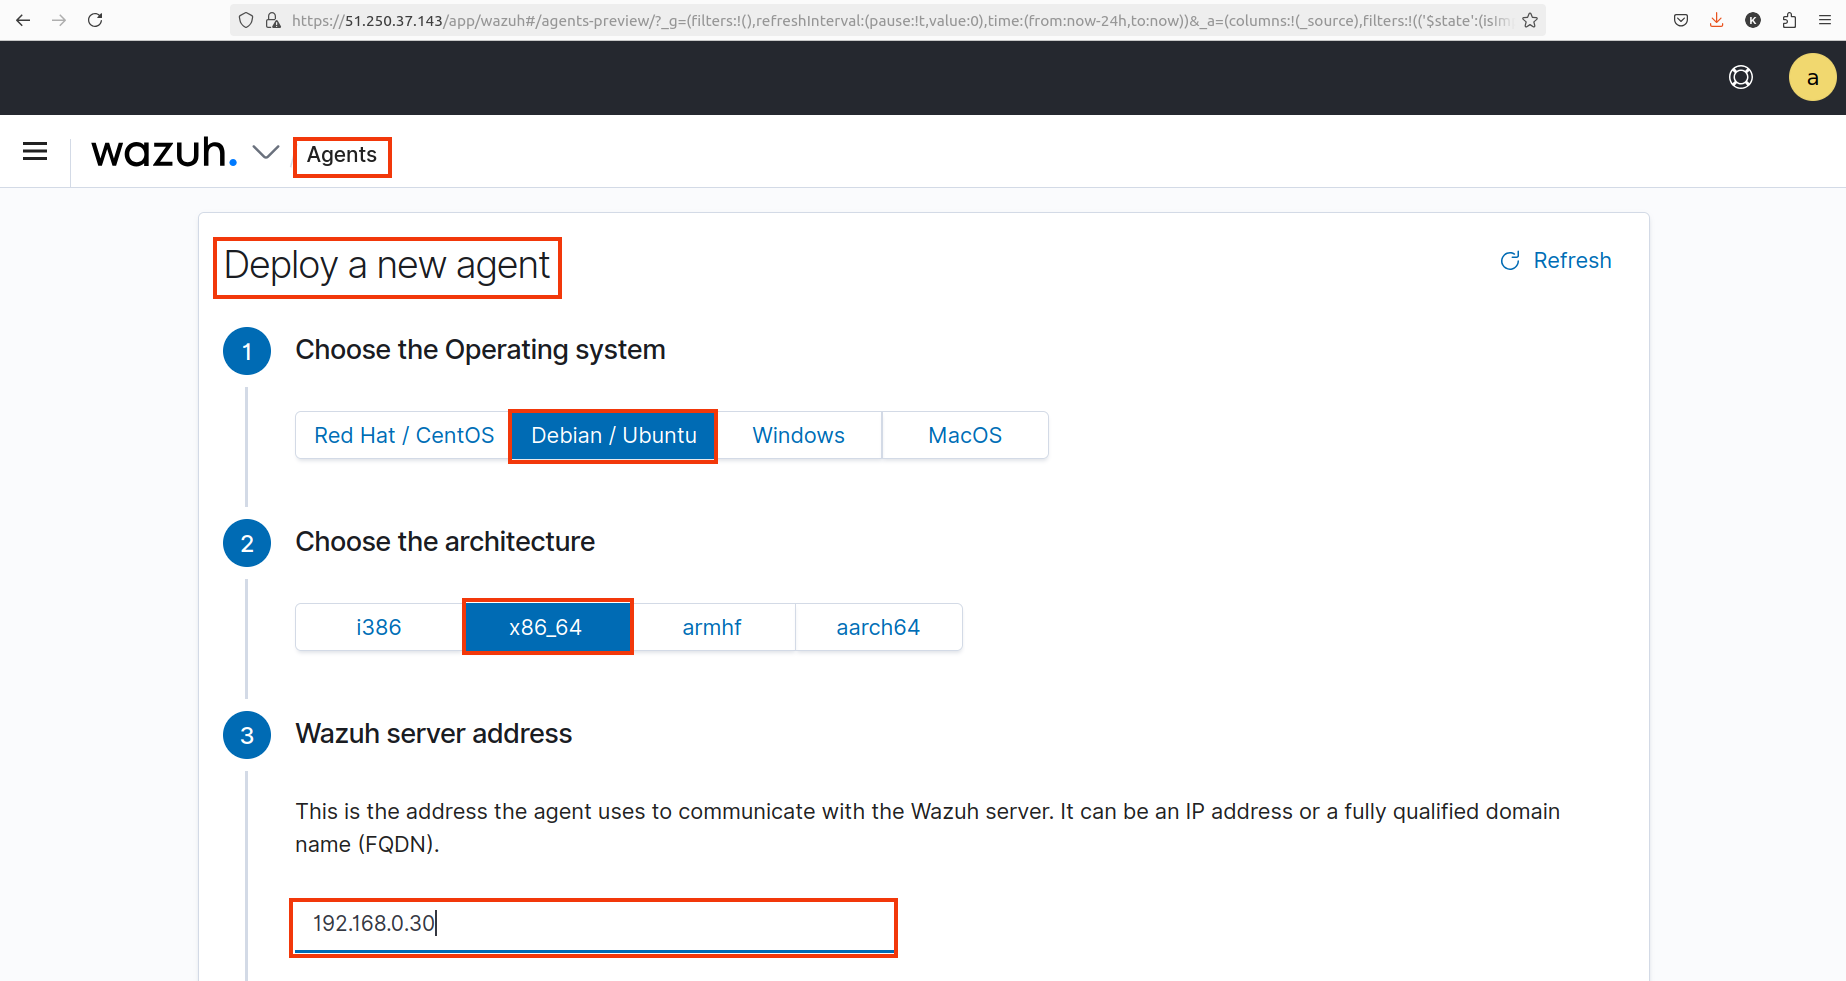
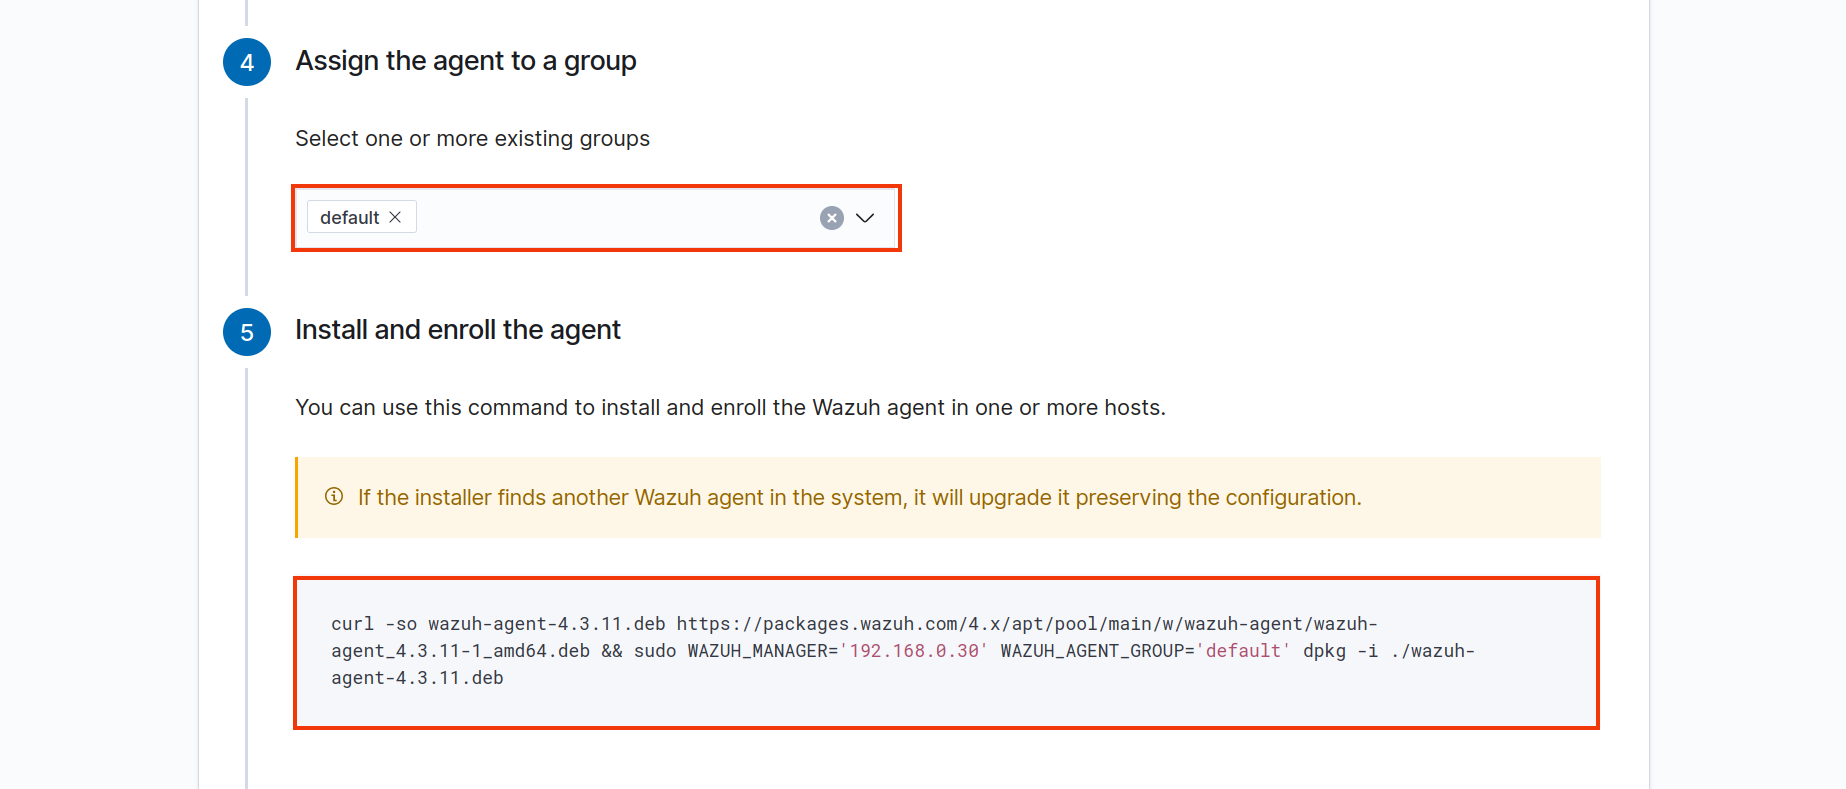
- Click Deploy new agent.
- Follow the steps described on the Deploy a new agent page.
2.1.2 Monitoring Docker events
Docker automates the deployment of different applications inside software containers. The Wazuh module for Docker identifies security incidents across containers and alerts in real-time. In this use case, you configure Wazuh to monitor Docker events on an Ubuntu endpoint hosting Docker containers.
Before you start monitoring
Docker containers with Wazuh, it's essential to enable the Docker Listener module in the Wazuh UI. This module allows the Wazuh agent to capture Docker events and forward them to the Wazuh server for analysis.
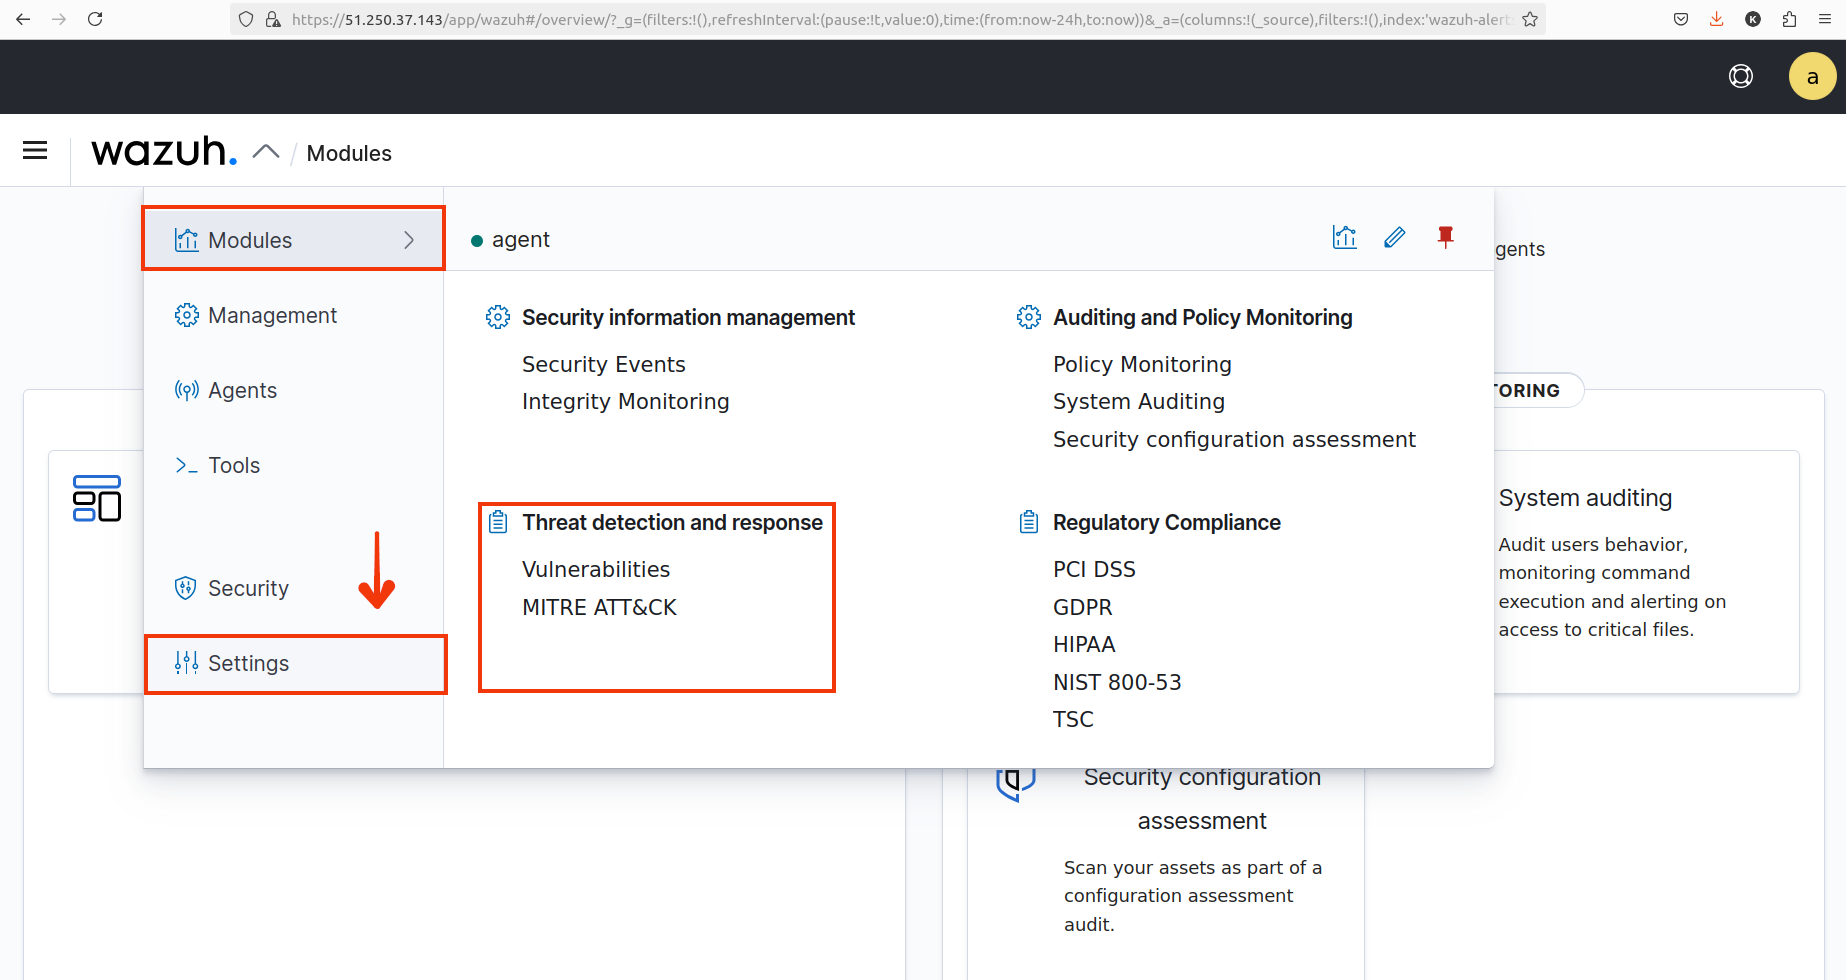
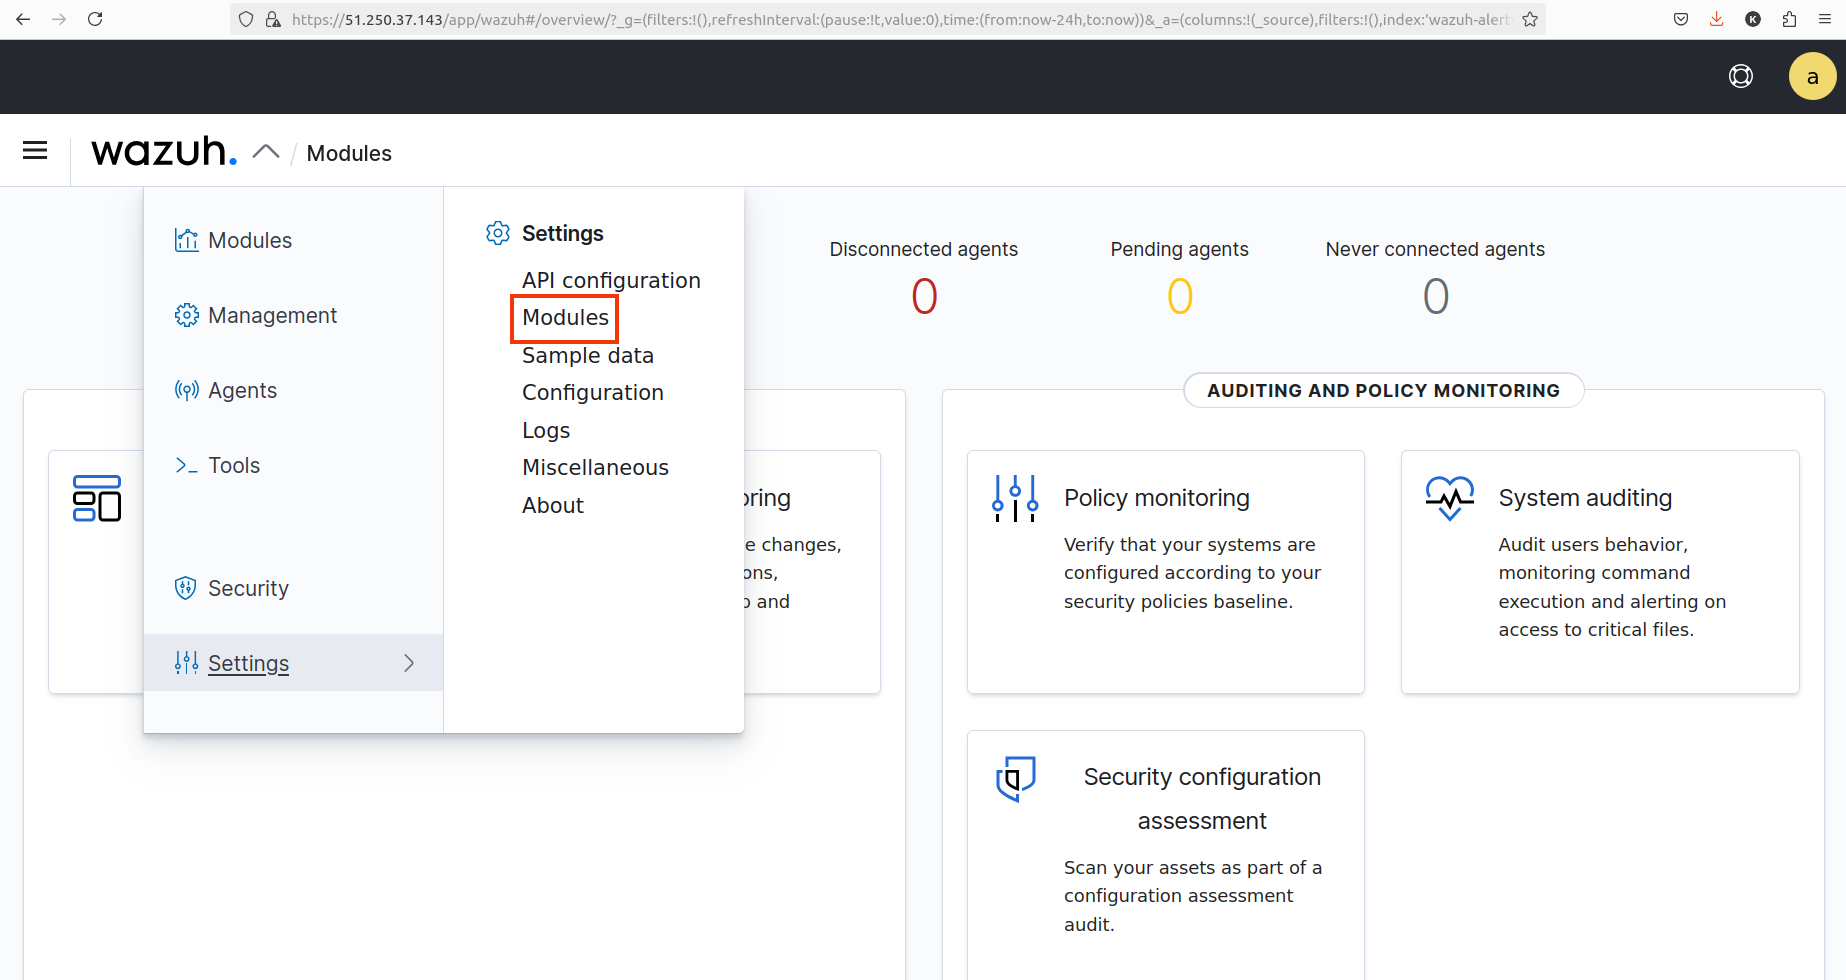
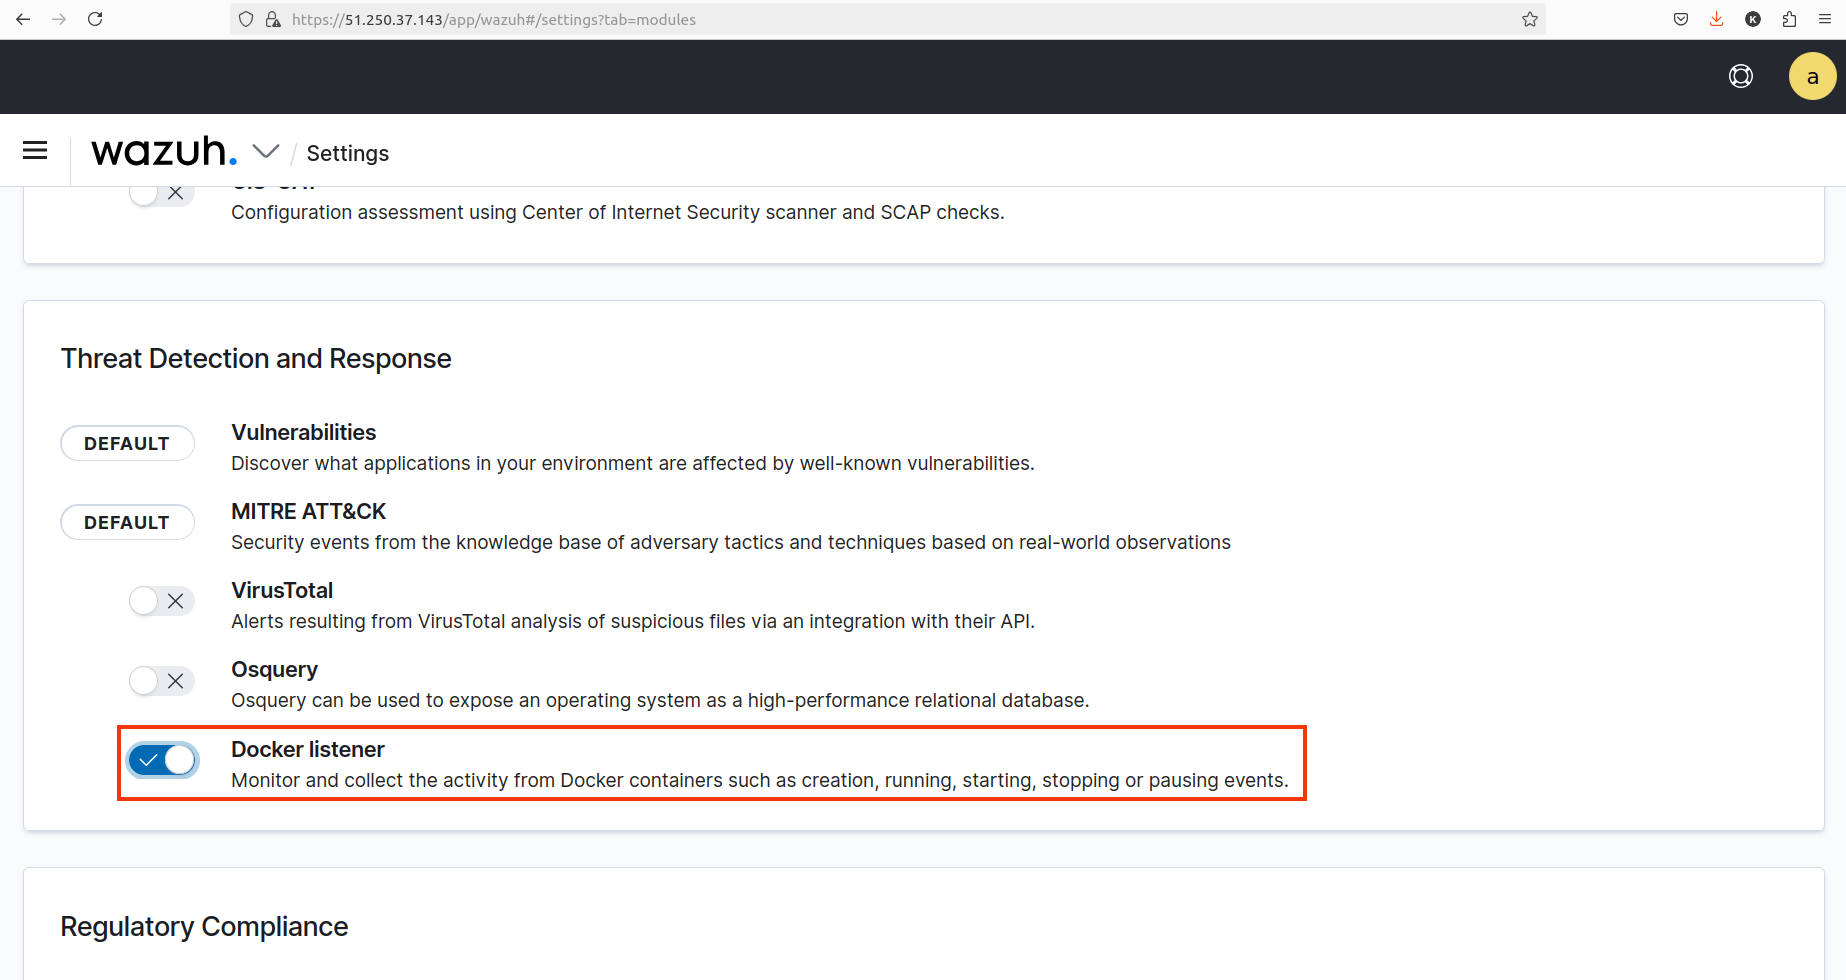
Perform the following steps to install Docker on the Ubuntu endpoint and configure Wazuh to monitor Docker events.
- Install Python and pip:
sudo apt install python3 python3-pip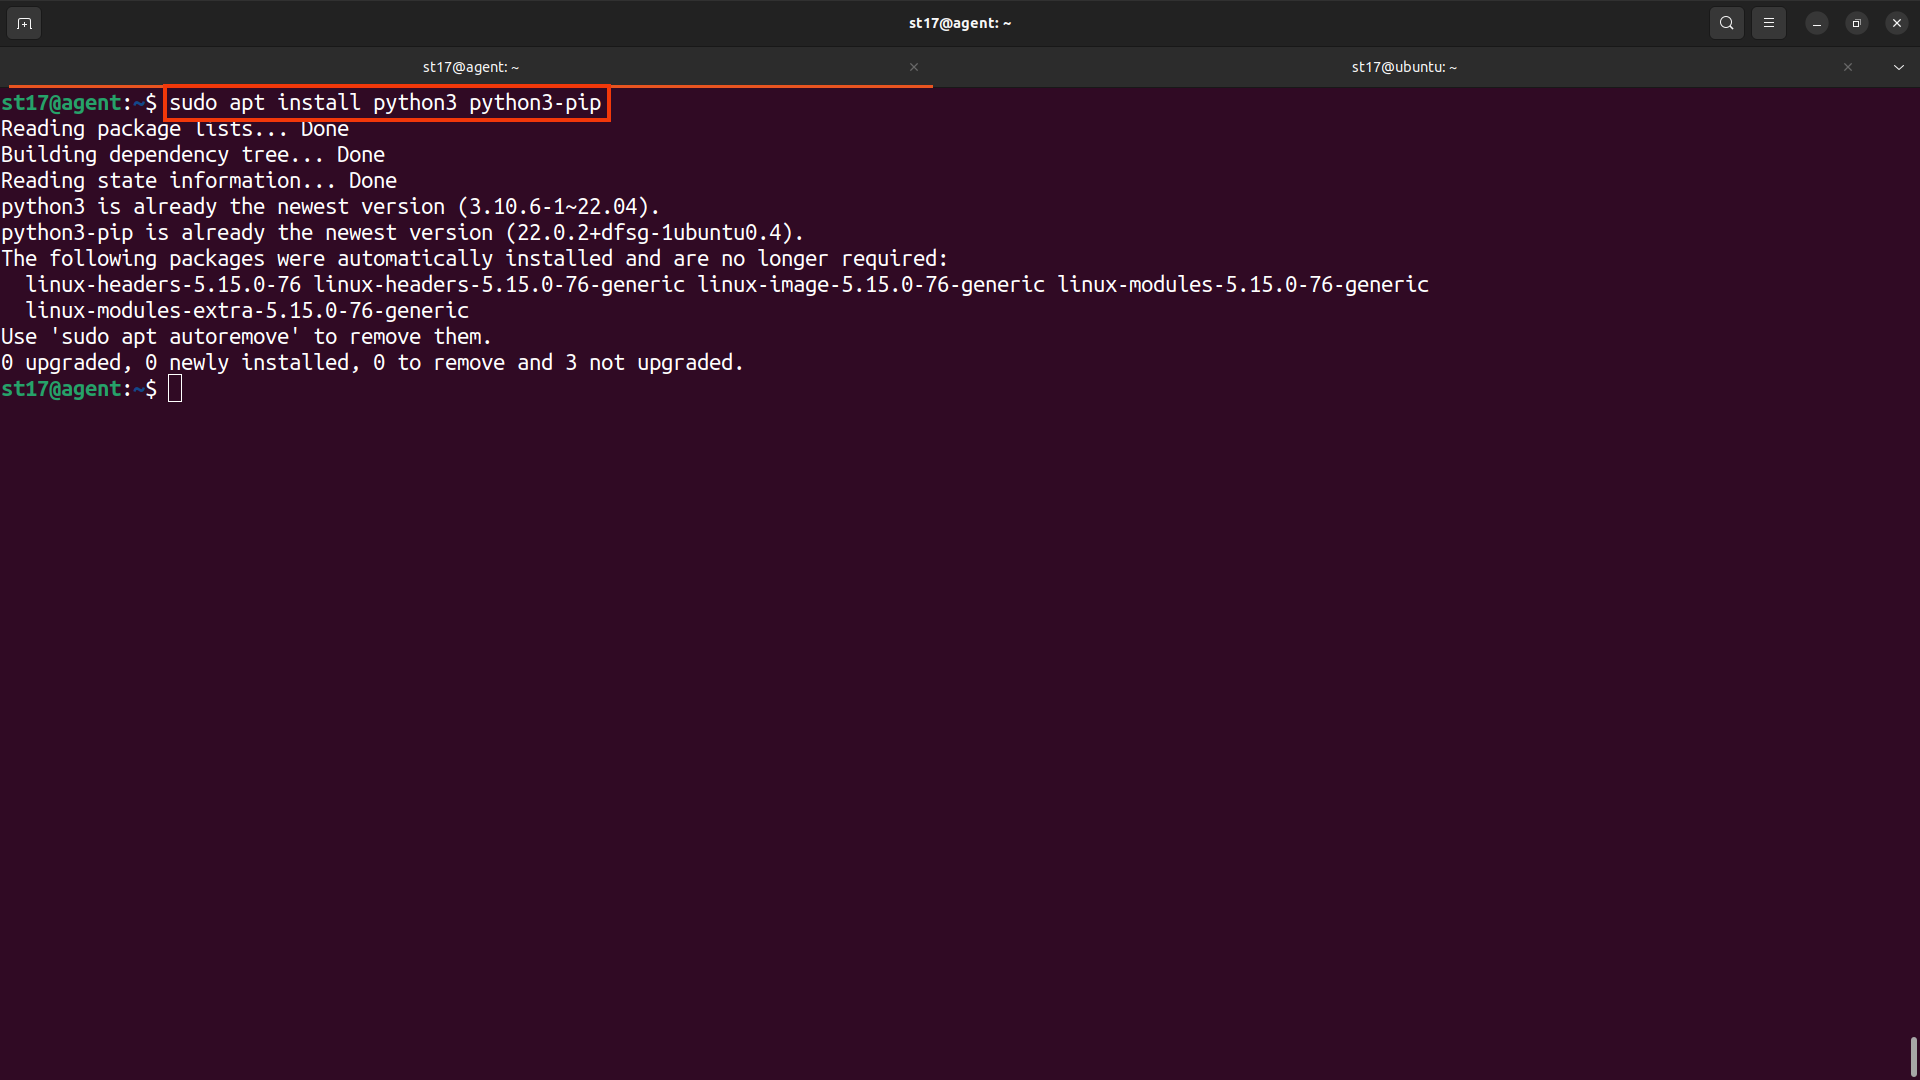
- Upgrade pip:
pip3 install --upgrade pip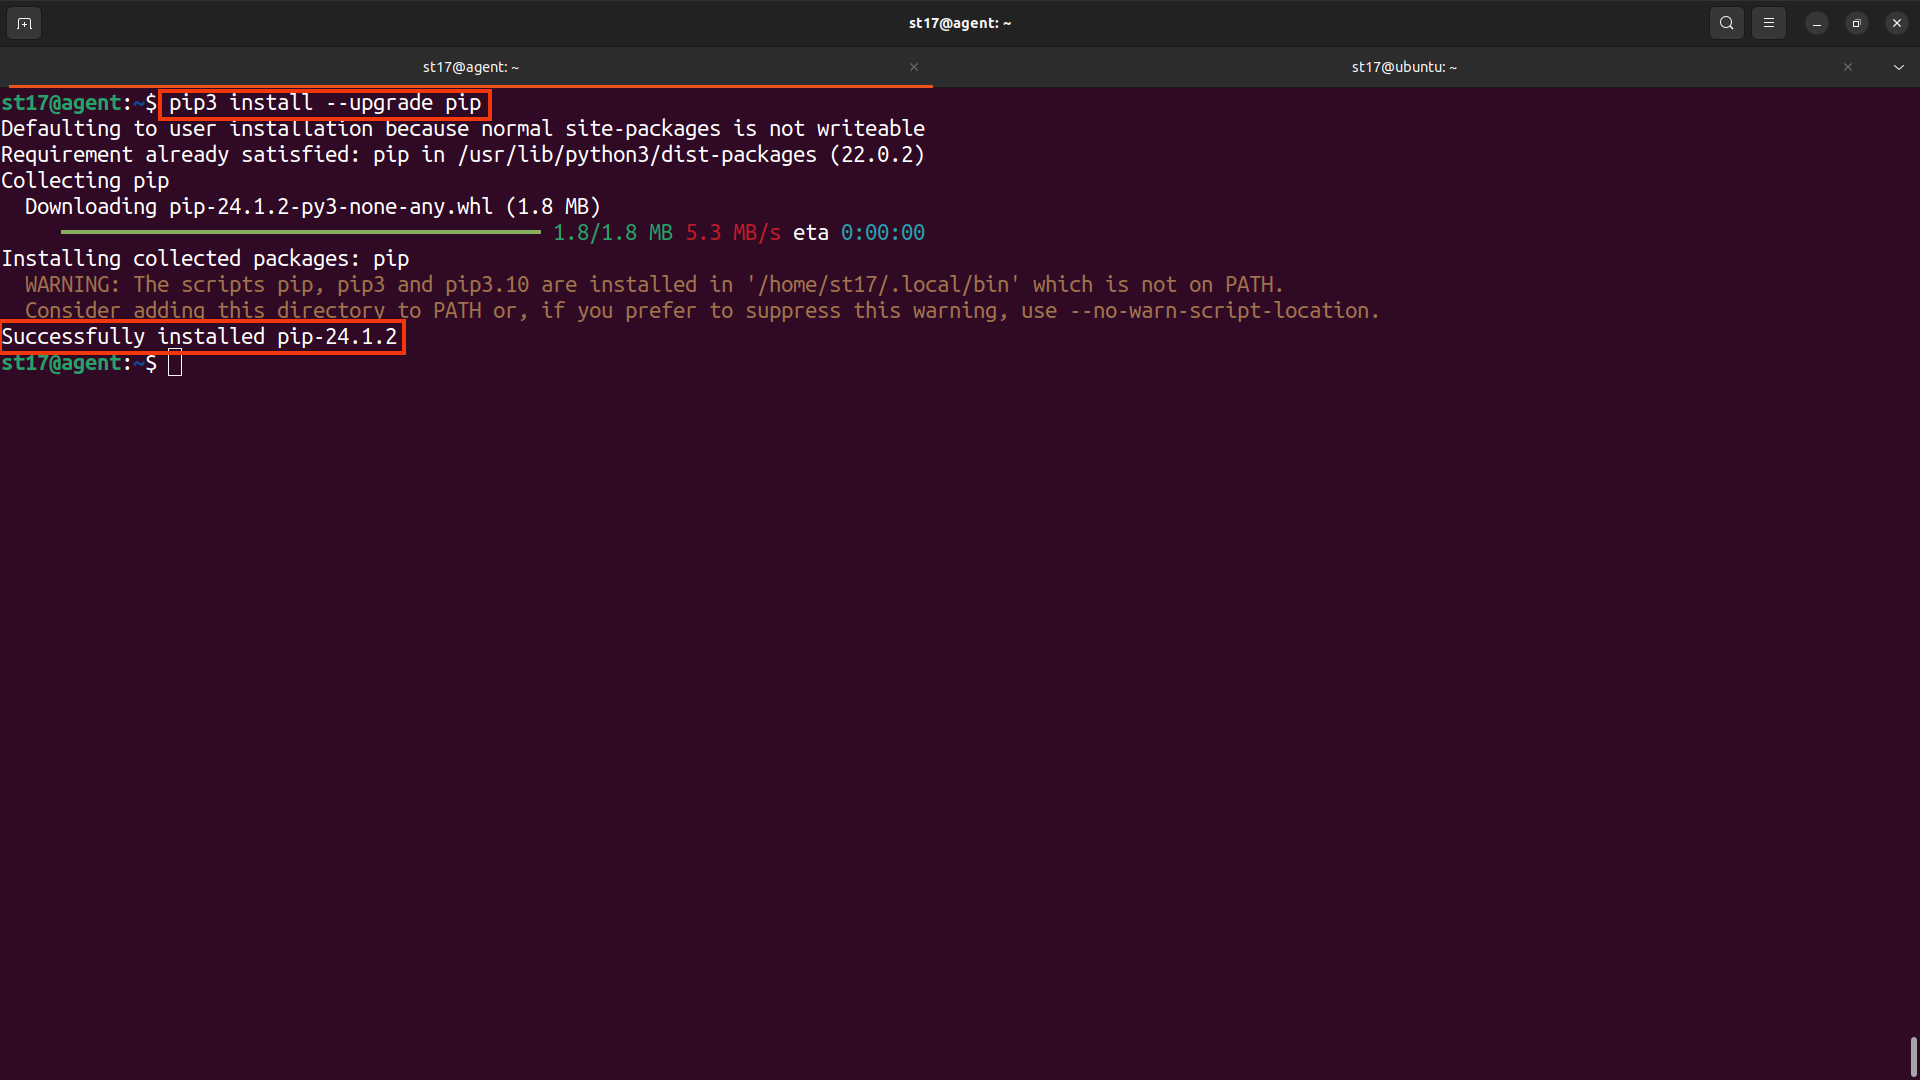
- Install Docker and Python Docker Library:
curl -sSL https://get.docker.com/ | sh
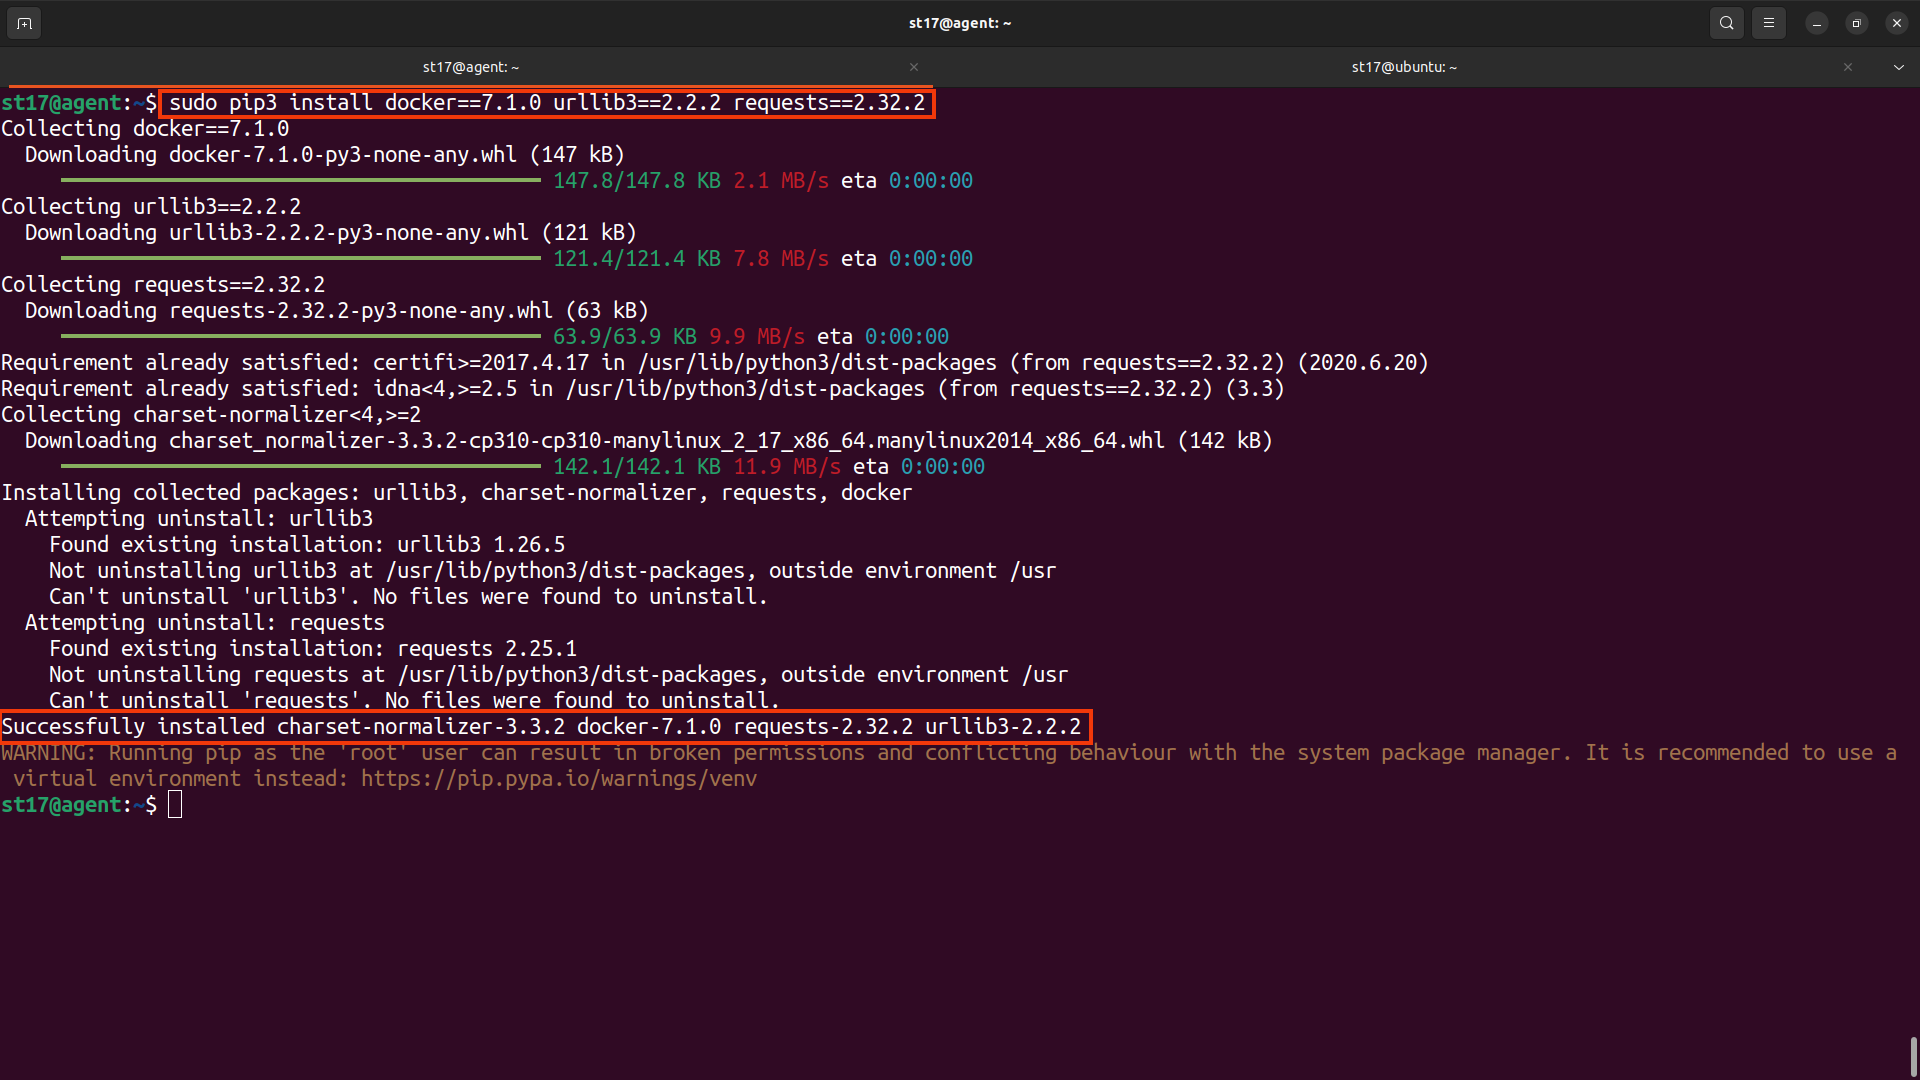
sudo pip3 install docker==7.1.0 urllib3==2.2.2 requests==2.32.2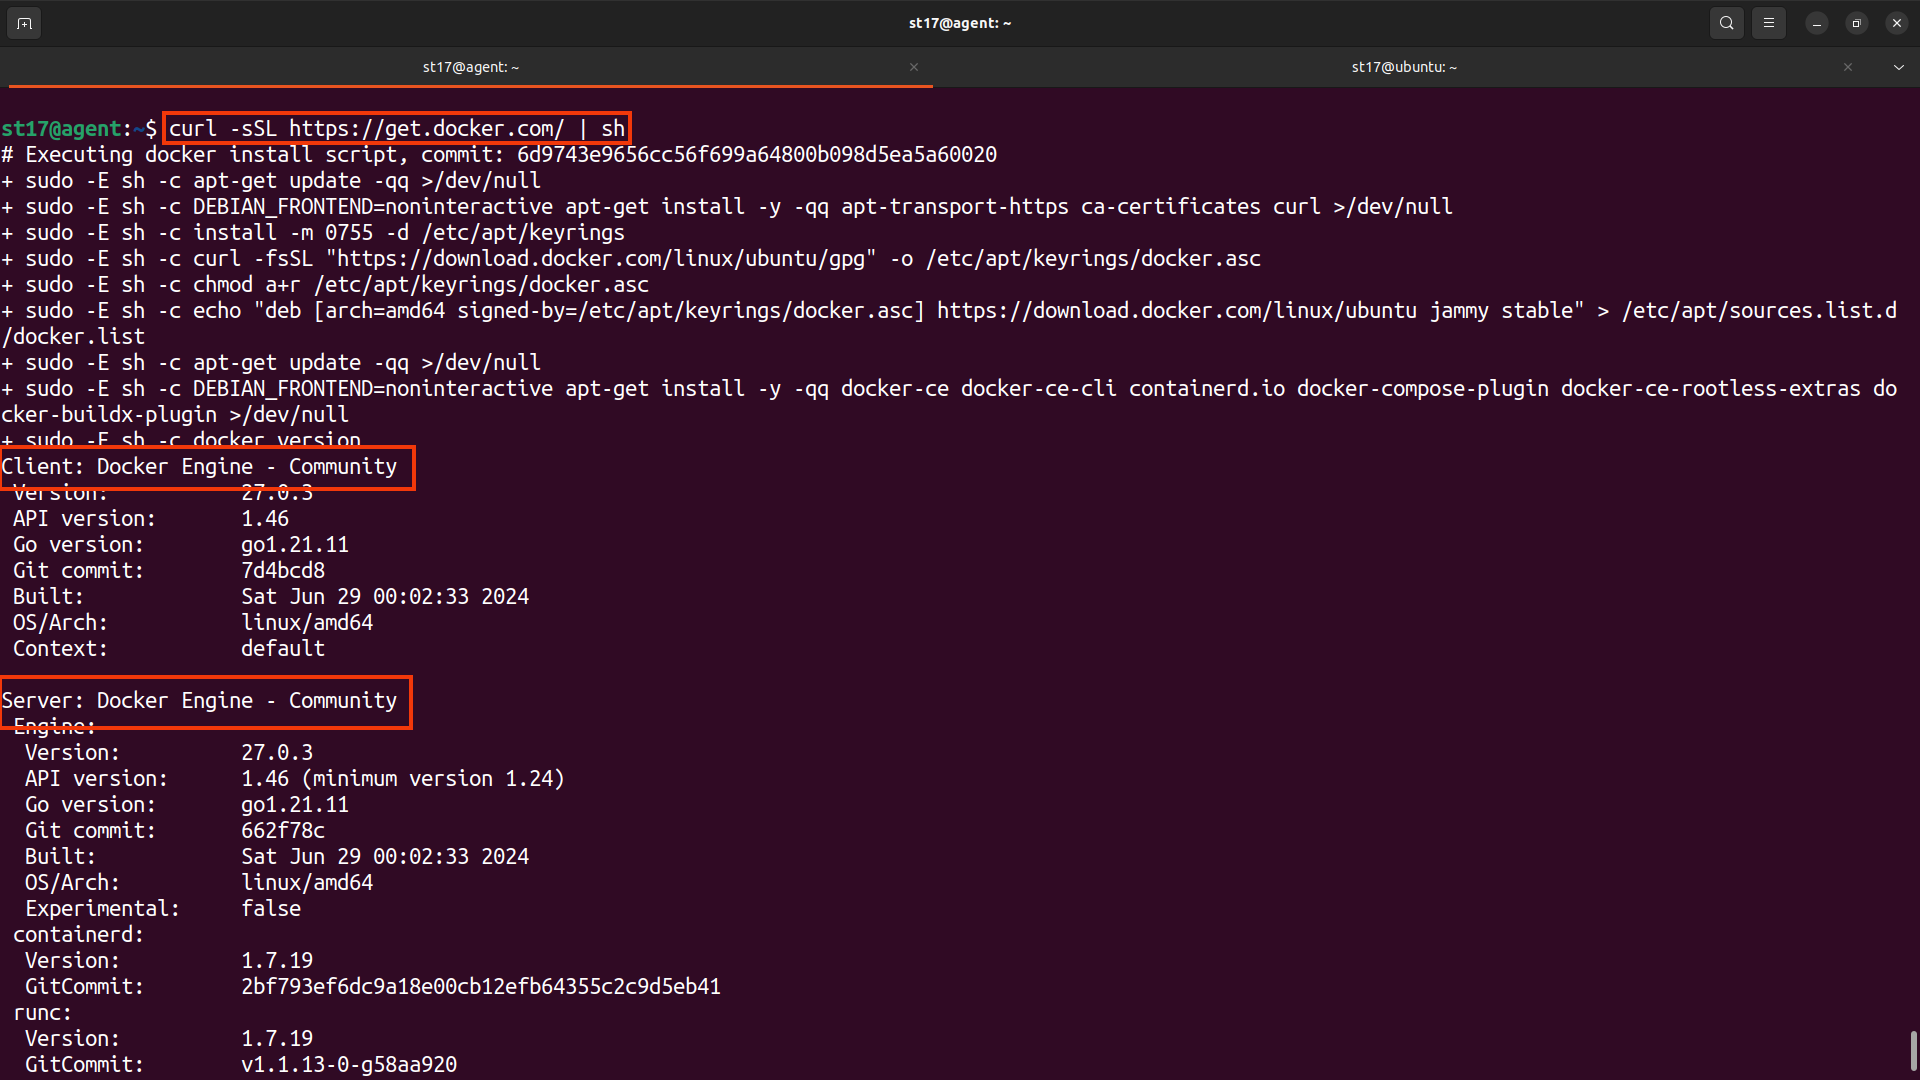
- Edit the Wazuh agent configuration file
/var/ossec/etc/ossec.confand add this block to enable thedocker-listenermodule:<ossec_config> <wodle name="docker-listener"> <interval>5m</interval> <attempts>5</attempts> <run_on_start>yes</run_on_start> <disabled>no</disabled> </wodle> </ossec_config>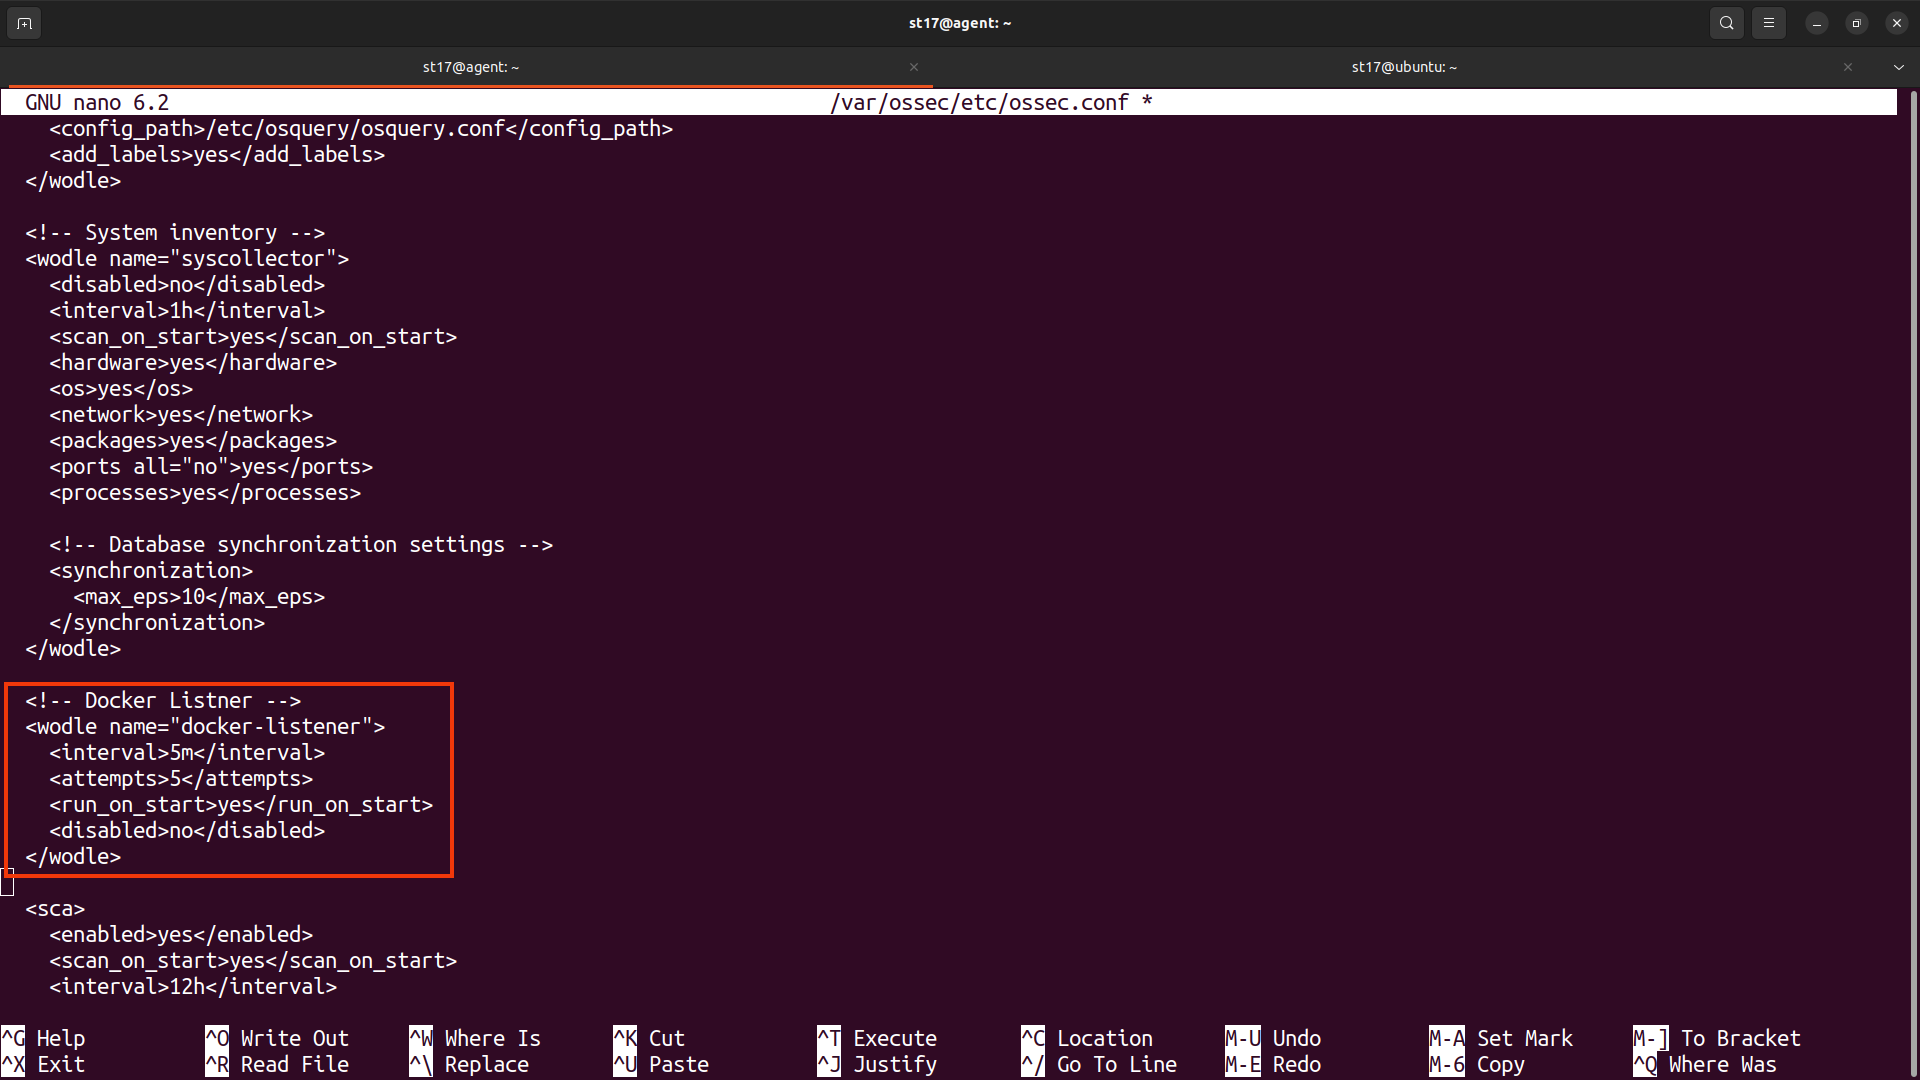
- Restart the Wazuh agent to apply the changes:
sudo systemctl restart wazuh-agent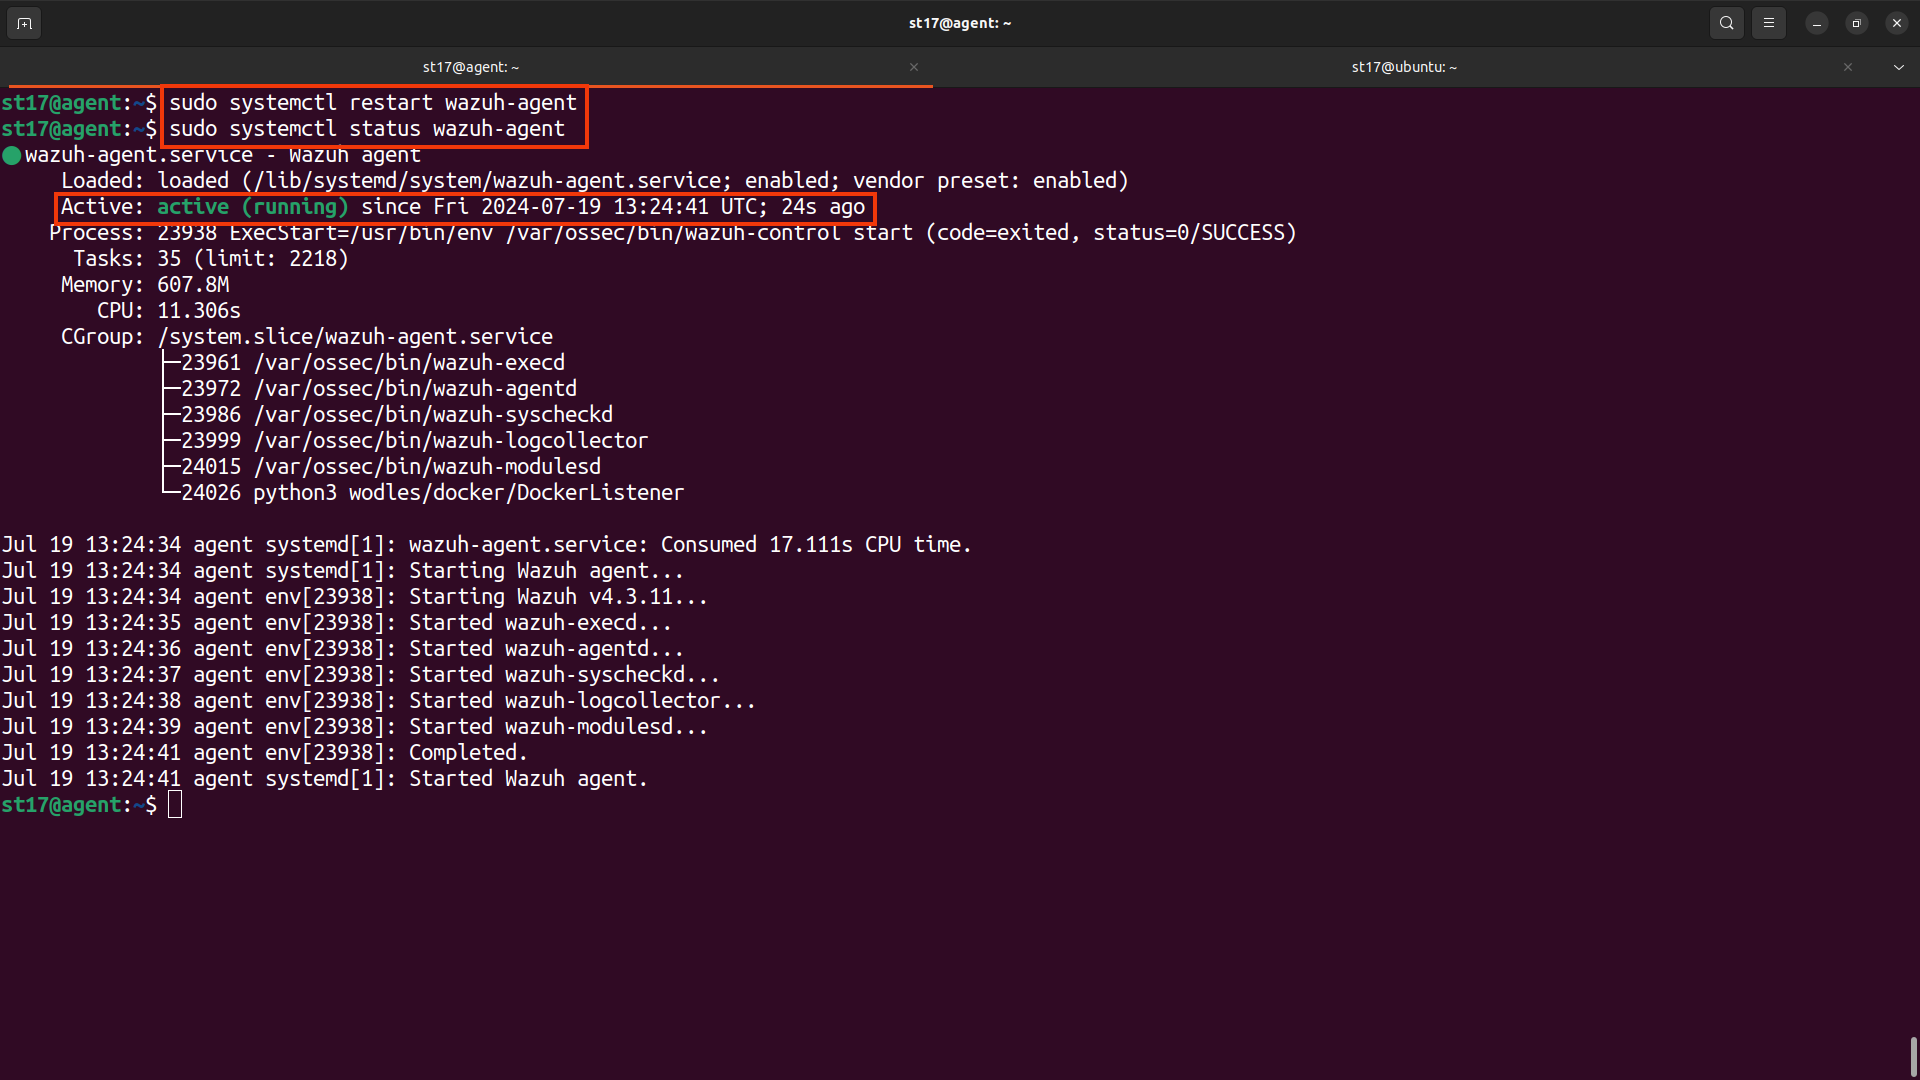
Perform several Docker activities like pulling a Docker image, starting an instance, running some other Docker commands, and then deleting the container.
- Pull an image, such as the NGINX image, and run a container:
sudo docker pull nginx
sudo docker run -d -P --name nginx_container nginx
sudo docker exec -it nginx_container cat /etc/passwd
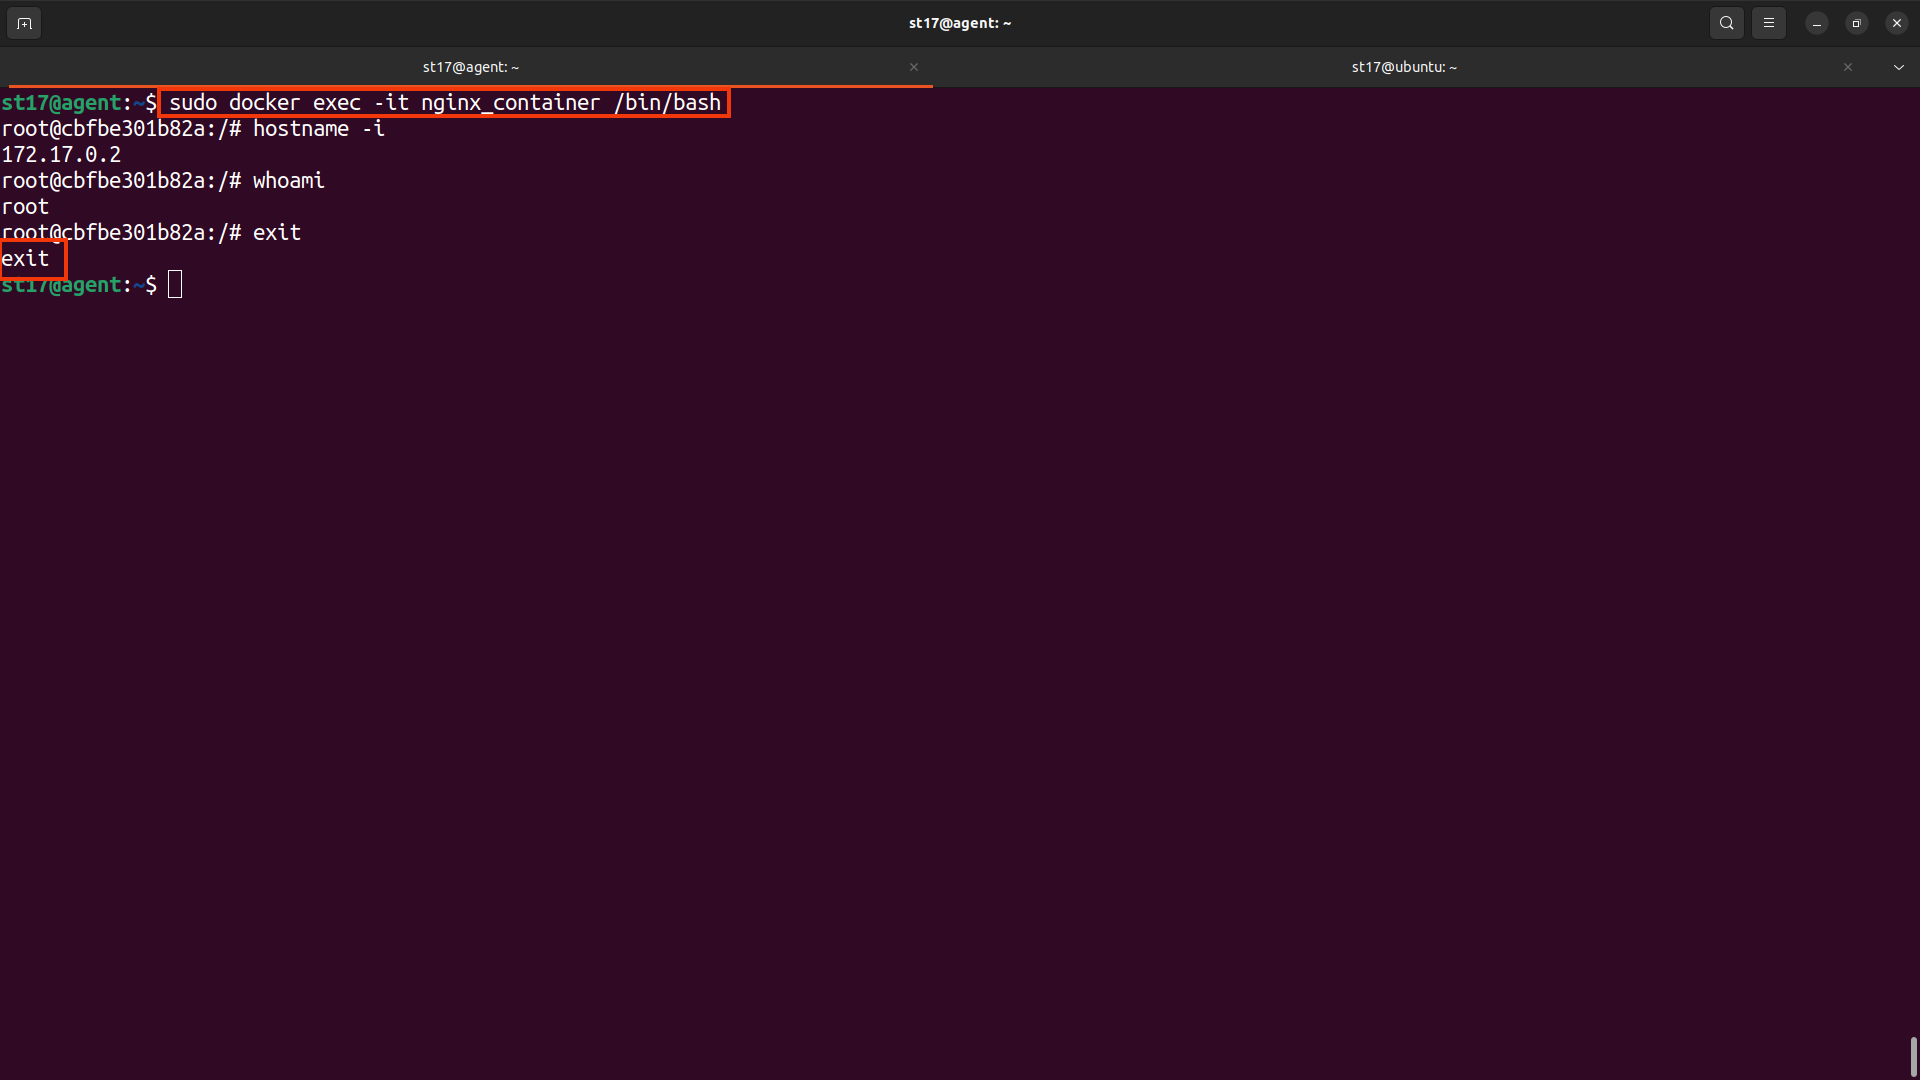
sudo docker exec -it nginx_container /bin/bash
exit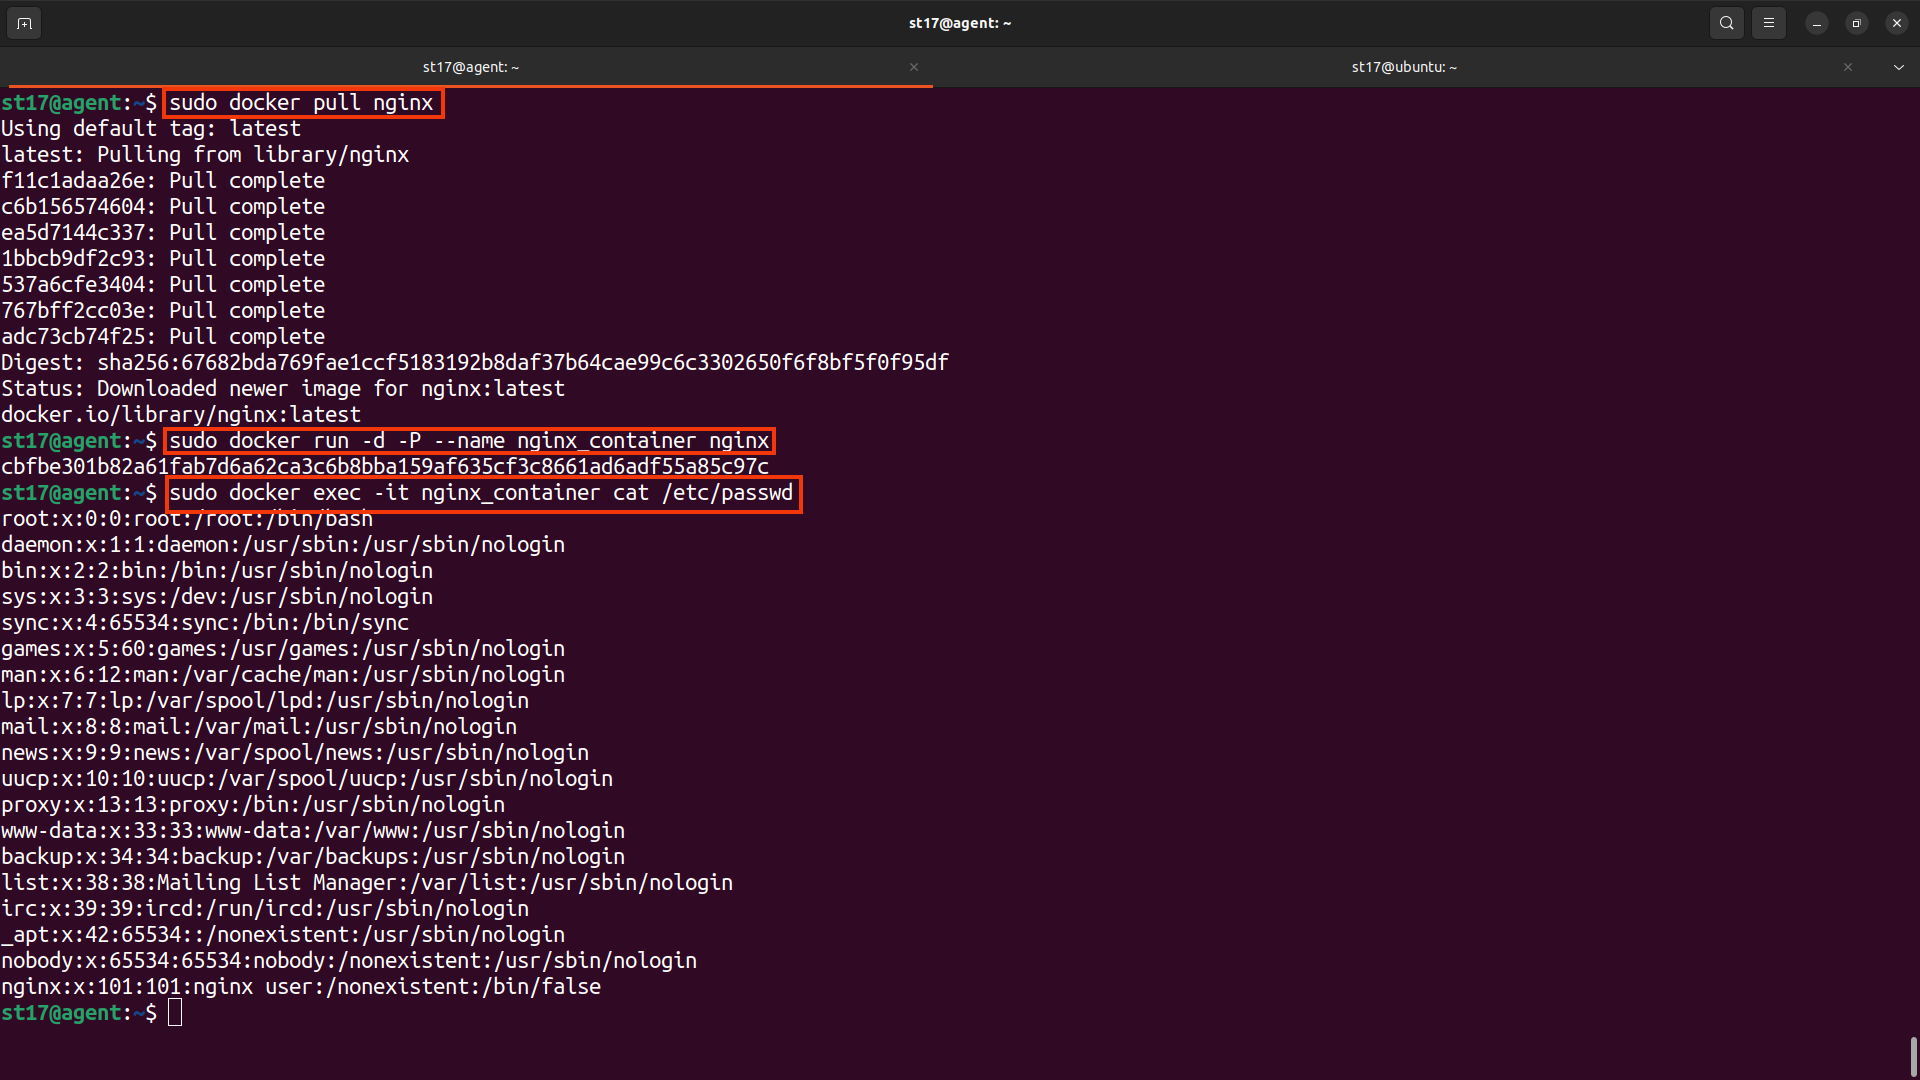
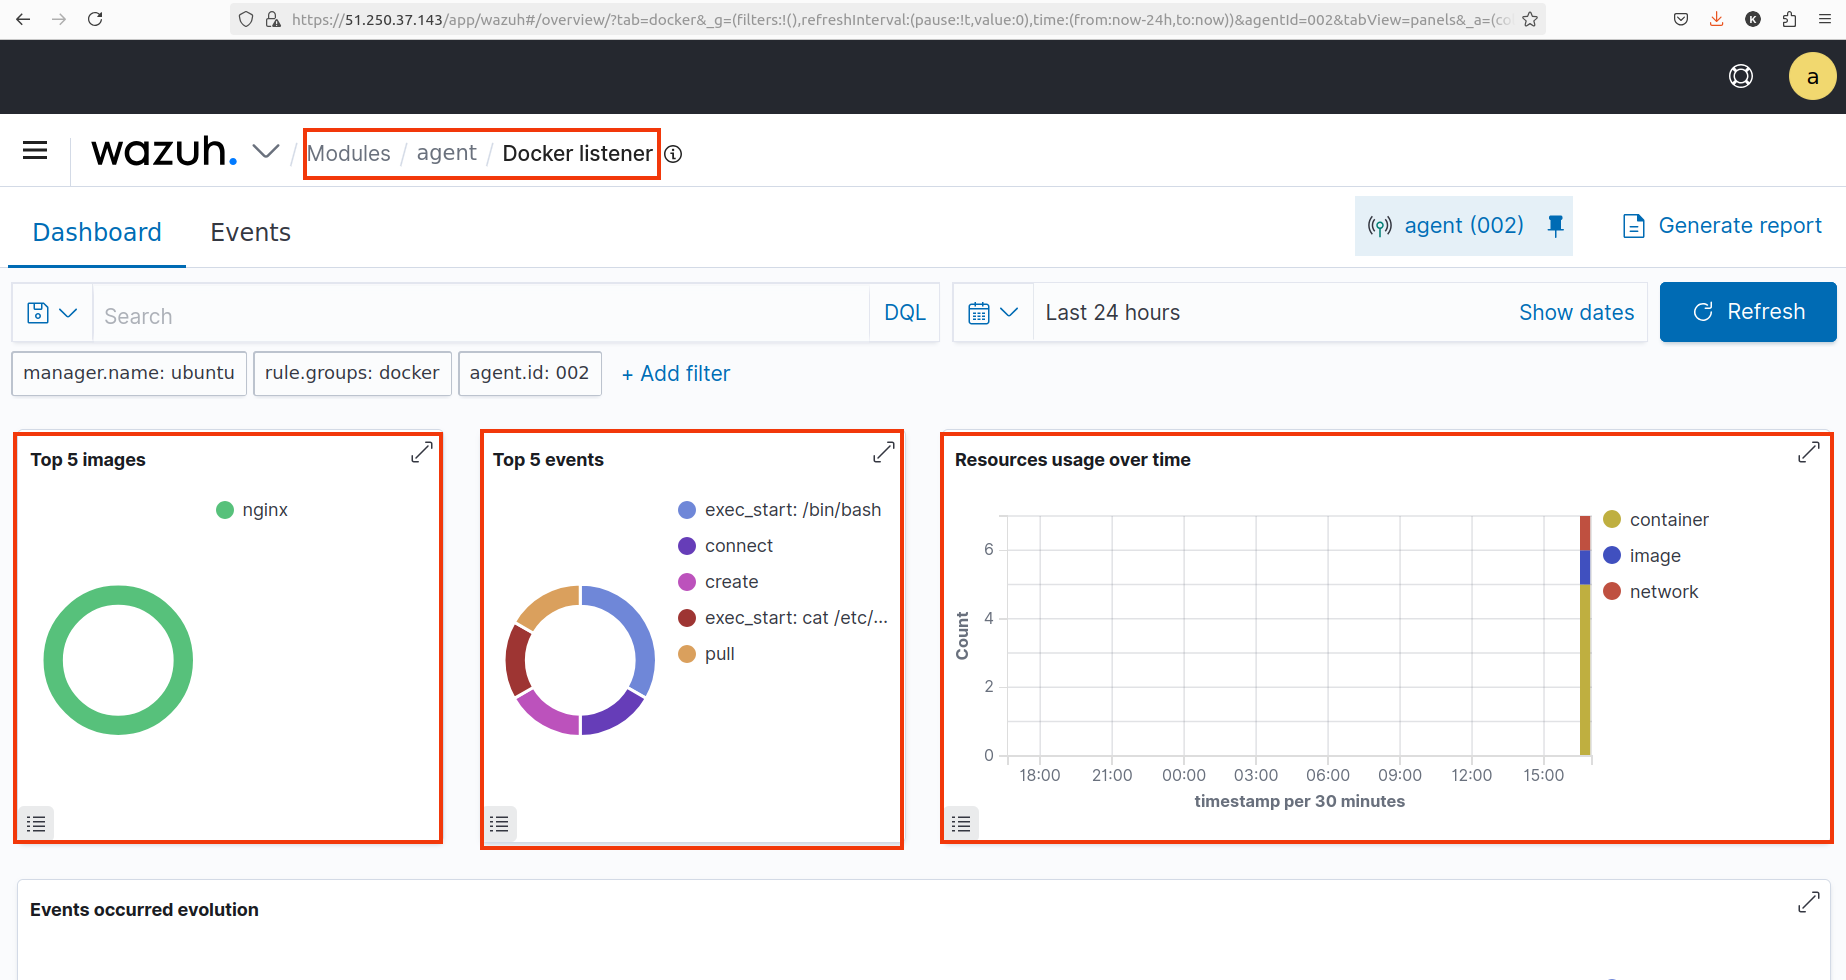
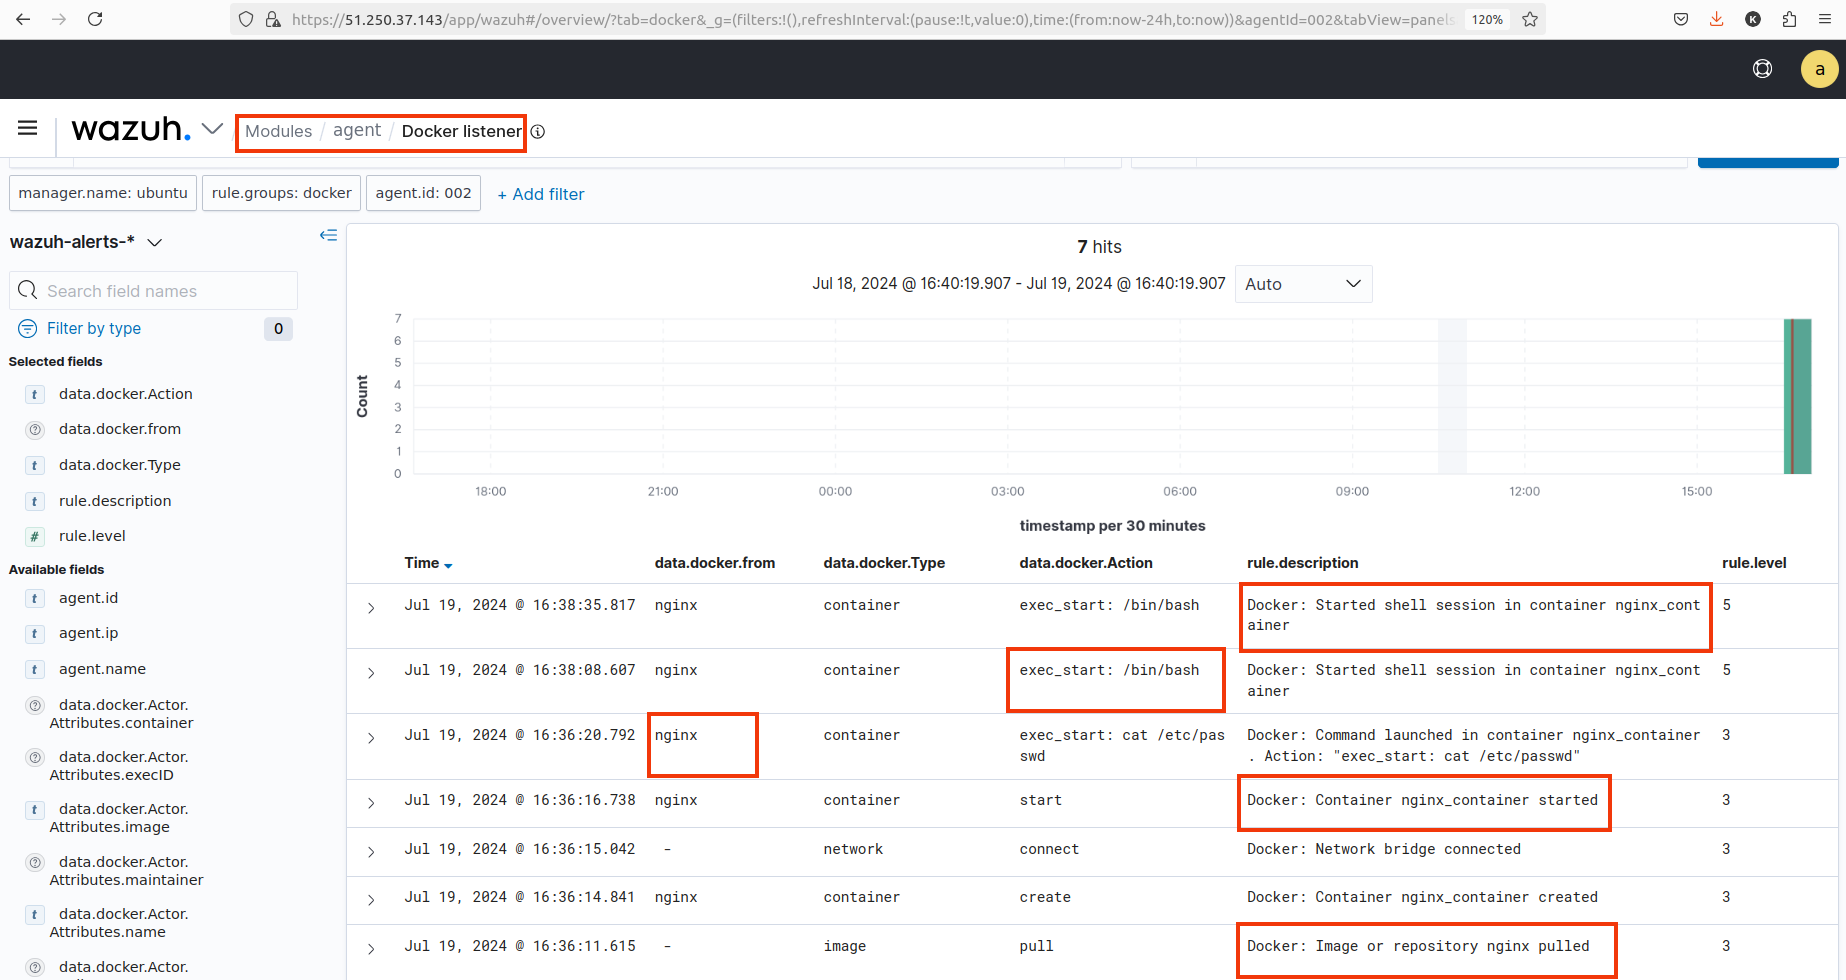
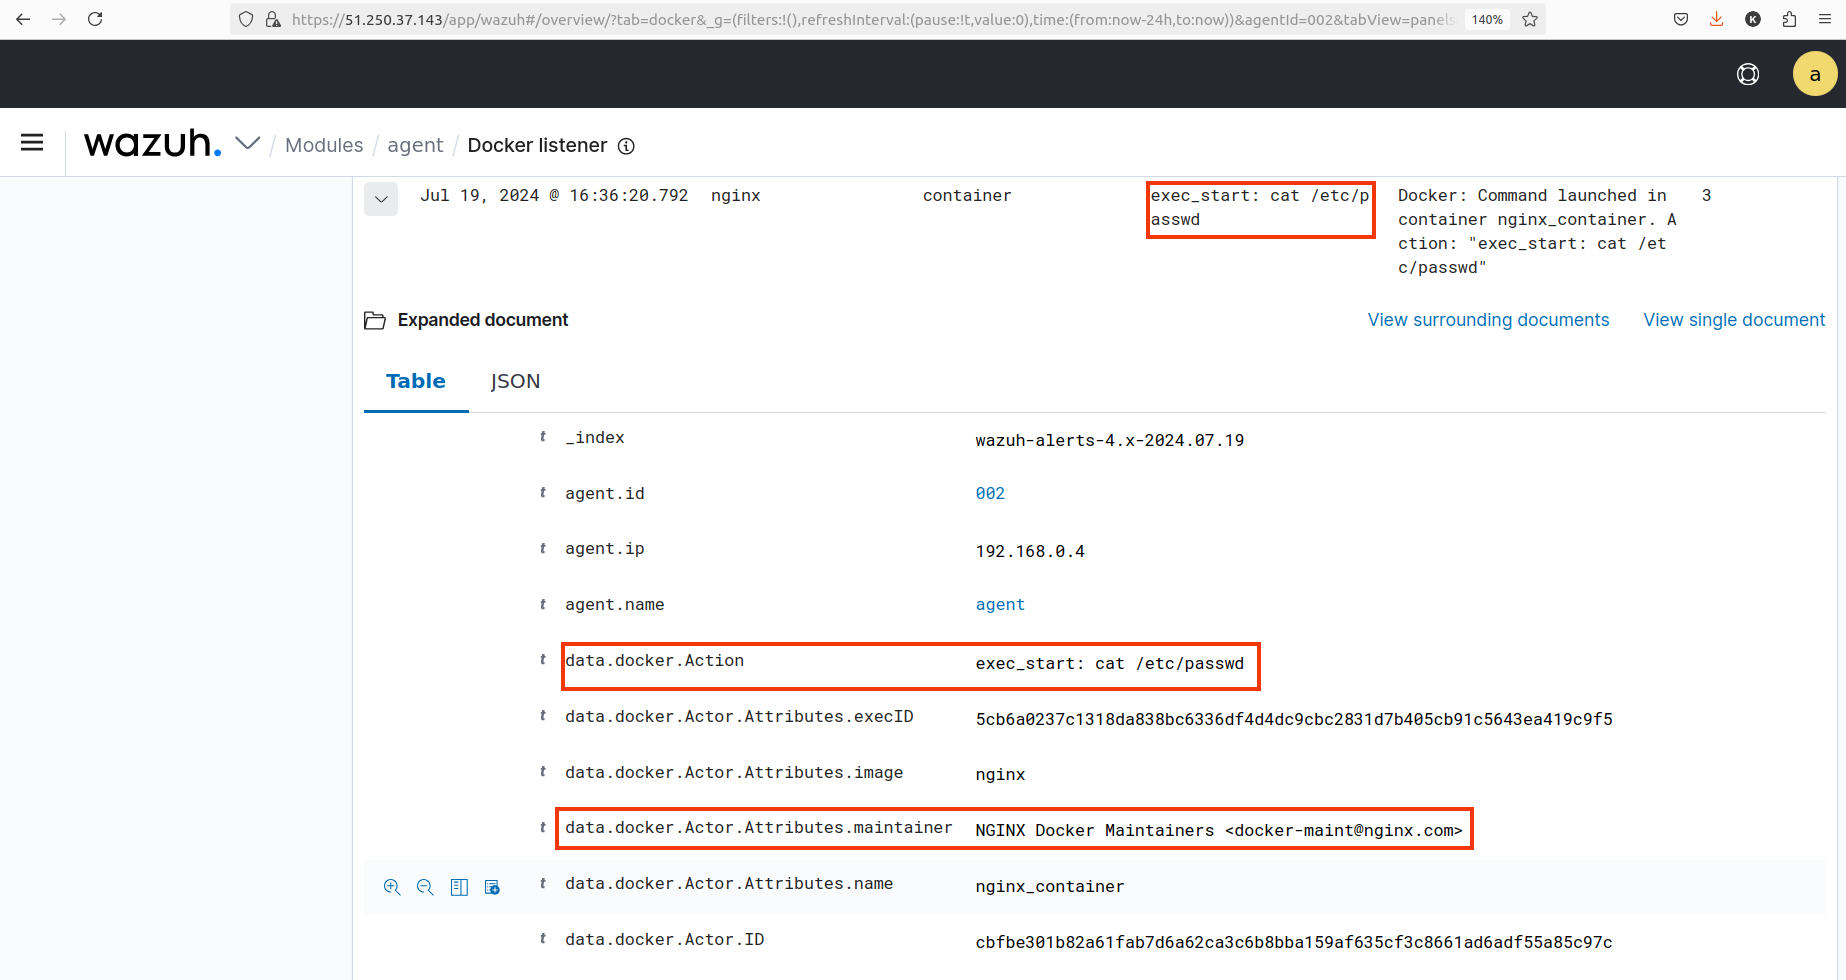
To detect vulnerabilities in Docker containers using Wazuh, you first need to configure Wazuh to monitor the logs generated by your Docker containers.
2.1.3 Monitoring Docker container logs
By default, Docker container logs only show stdout and stderr standard streams, which are cleared when the container is destroyed. However, when non-interactive processes, like a database or web server are run, logs pertaining to these processes are generated. These logs can be collected using Docker logging drivers and saved to a file. If the design of a container is good enough, it can provide valuable logs to be examined.
By default, when a container is created by the docker engine, the JSON File logging driver is used. Logs captured this way can be found in /var/lib/docker/containers/[container-id]/[container-id]-json.log. The Wazuh agent can collect logs directly from this location but the
logs do not provide enough information about which container produced it. This might be a problem when we have a large number of containers.
Rsyslog is used to improve the container logs by tagging them with their respective container names and grouping them in a directory. The JSON File logging driver doesn’t allow the log file location to be changed, so we will use the Syslog logging driver instead.
When creating a container, the --log-driver tag can be specified to set the log driver which will be used. A more global approach is to use a configuration that sets the logging driver for all containers created.
To set the global logging driver, create or edit /etc/docker/daemon.json. This way all containers created henceforth will use the Syslog driver:
{
  "log-driver": "syslog",
  "log-opts": {
    "syslog-address": "unixgram:///dev/log",
    "tag": "docker/{{.Name}}"
  }
}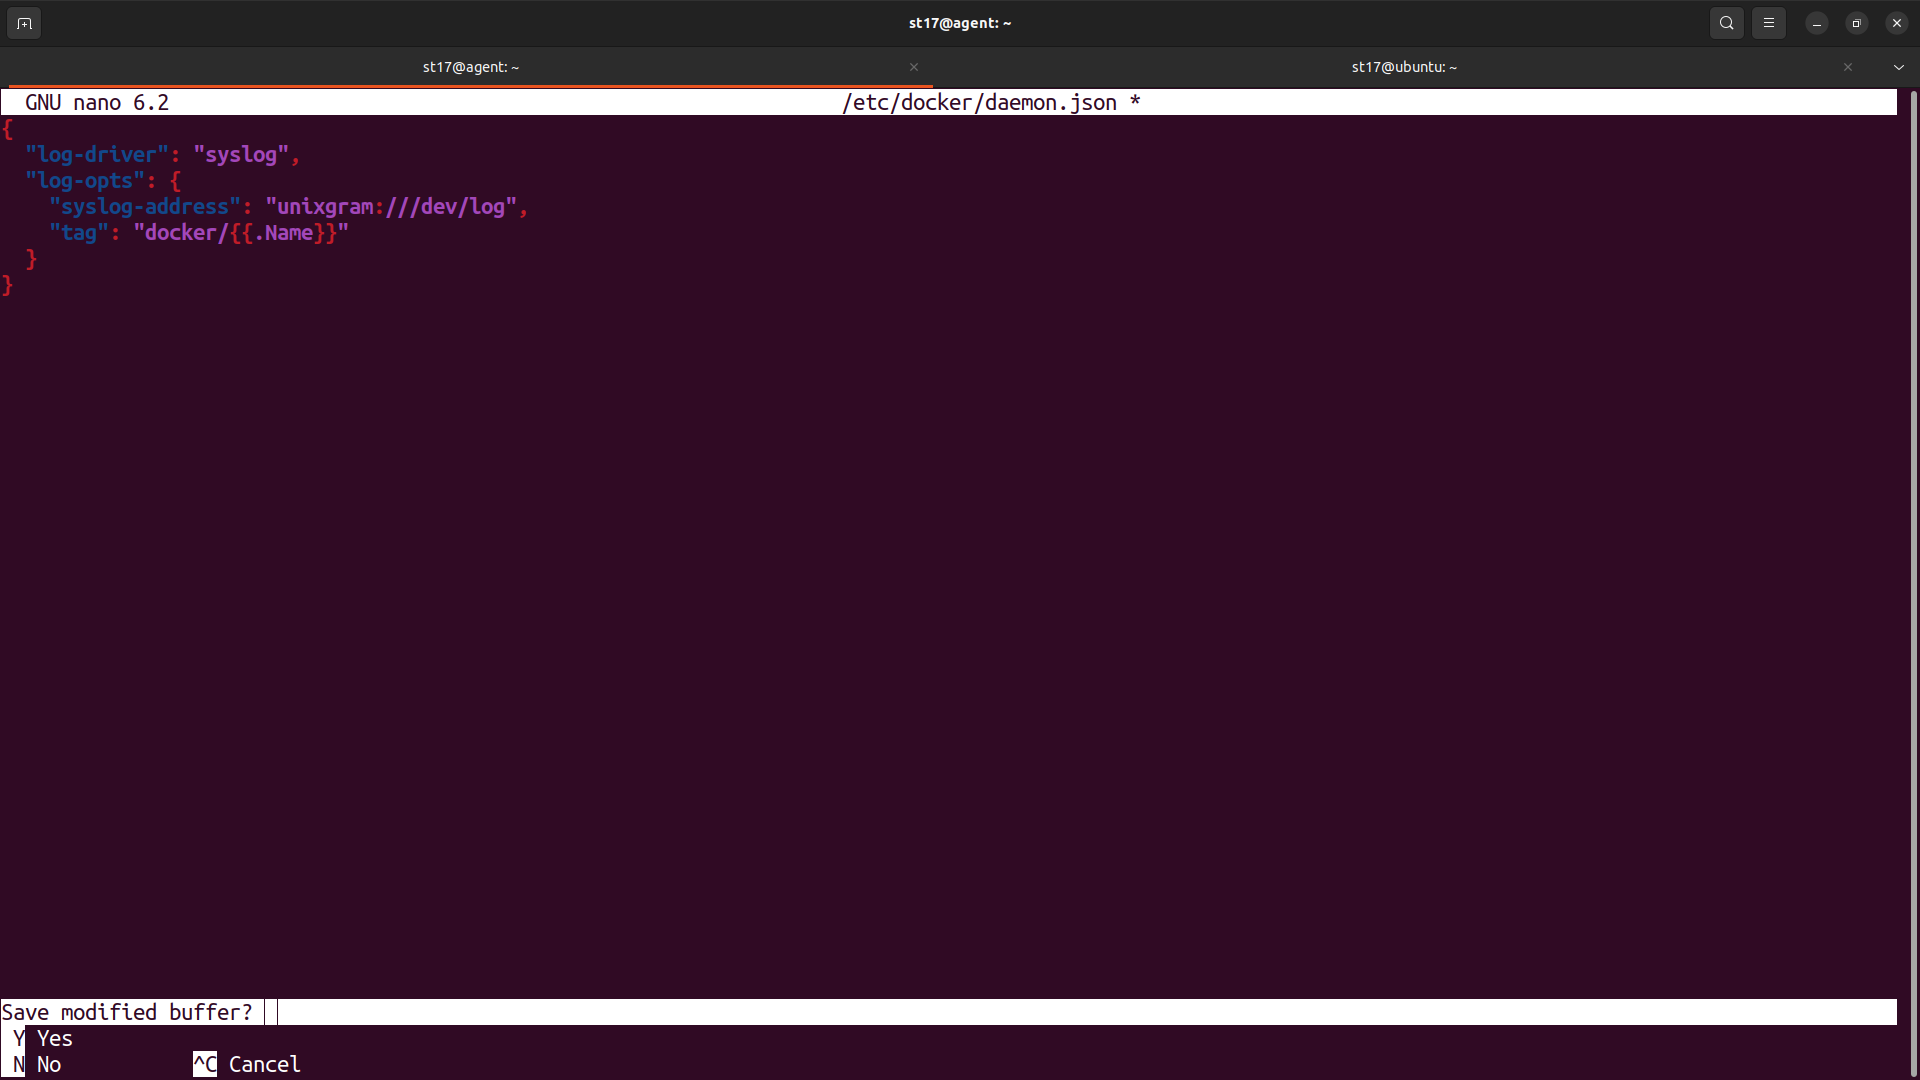
The configuration above specifies:
- The type of log driver used, which in this case is Syslog.
- That log messages will be channeled to
unixgram:///dev/log, then the Rsyslog daemon pulls data from that socket.
- That log messages will be tagged with
docker/{{.Name}}, where{{.Name}}replaces the container name.
Restart the Docker service to apply changes:
systemctl restart docker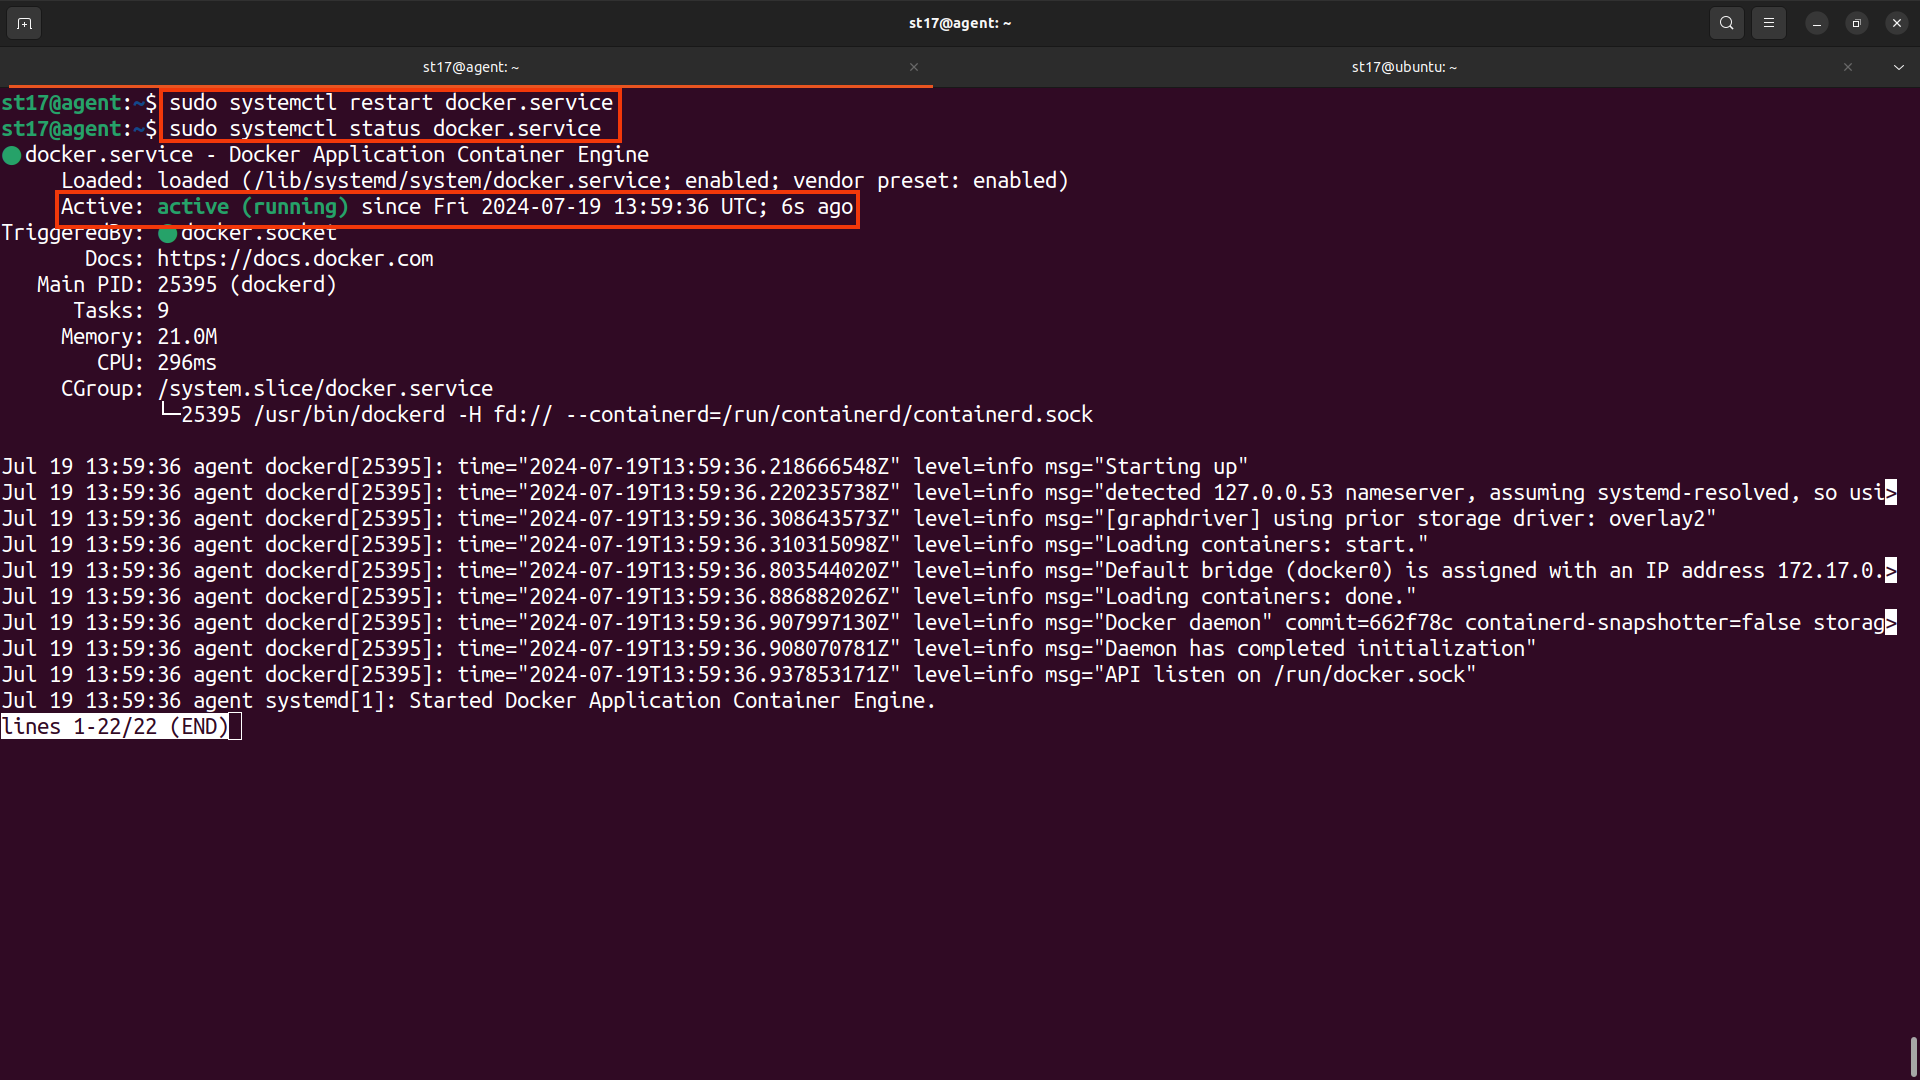
We need to configure Rsyslog to create and tag new logs from containers in the /var/log/docker folder.
Let’s create a configuration file called wazuh-docker.conf in the /etc/rsyslog.d/ directory:
$FileCreateMode 0644
$template DockerDaemonLogFileName,"/var/log/docker/docker.log"
$template DockerContainerLogFileName,"/var/log/docker/%SYSLOGTAG:R,ERE,1,FIELD:docker/(.*)\[--end:secpath-replace%.log"
if $programname == 'dockerd' then {
  ?DockerDaemonLogFileName
  stop
}
if $programname == 'containerd' then {
  ?DockerDaemonLogFileName
  stop
}
if $programname == 'docker' then {
  if $syslogtag contains 'docker/' then {
  ?DockerContainerLogFileName
  stop
  }
}
$FileCreateMode 0600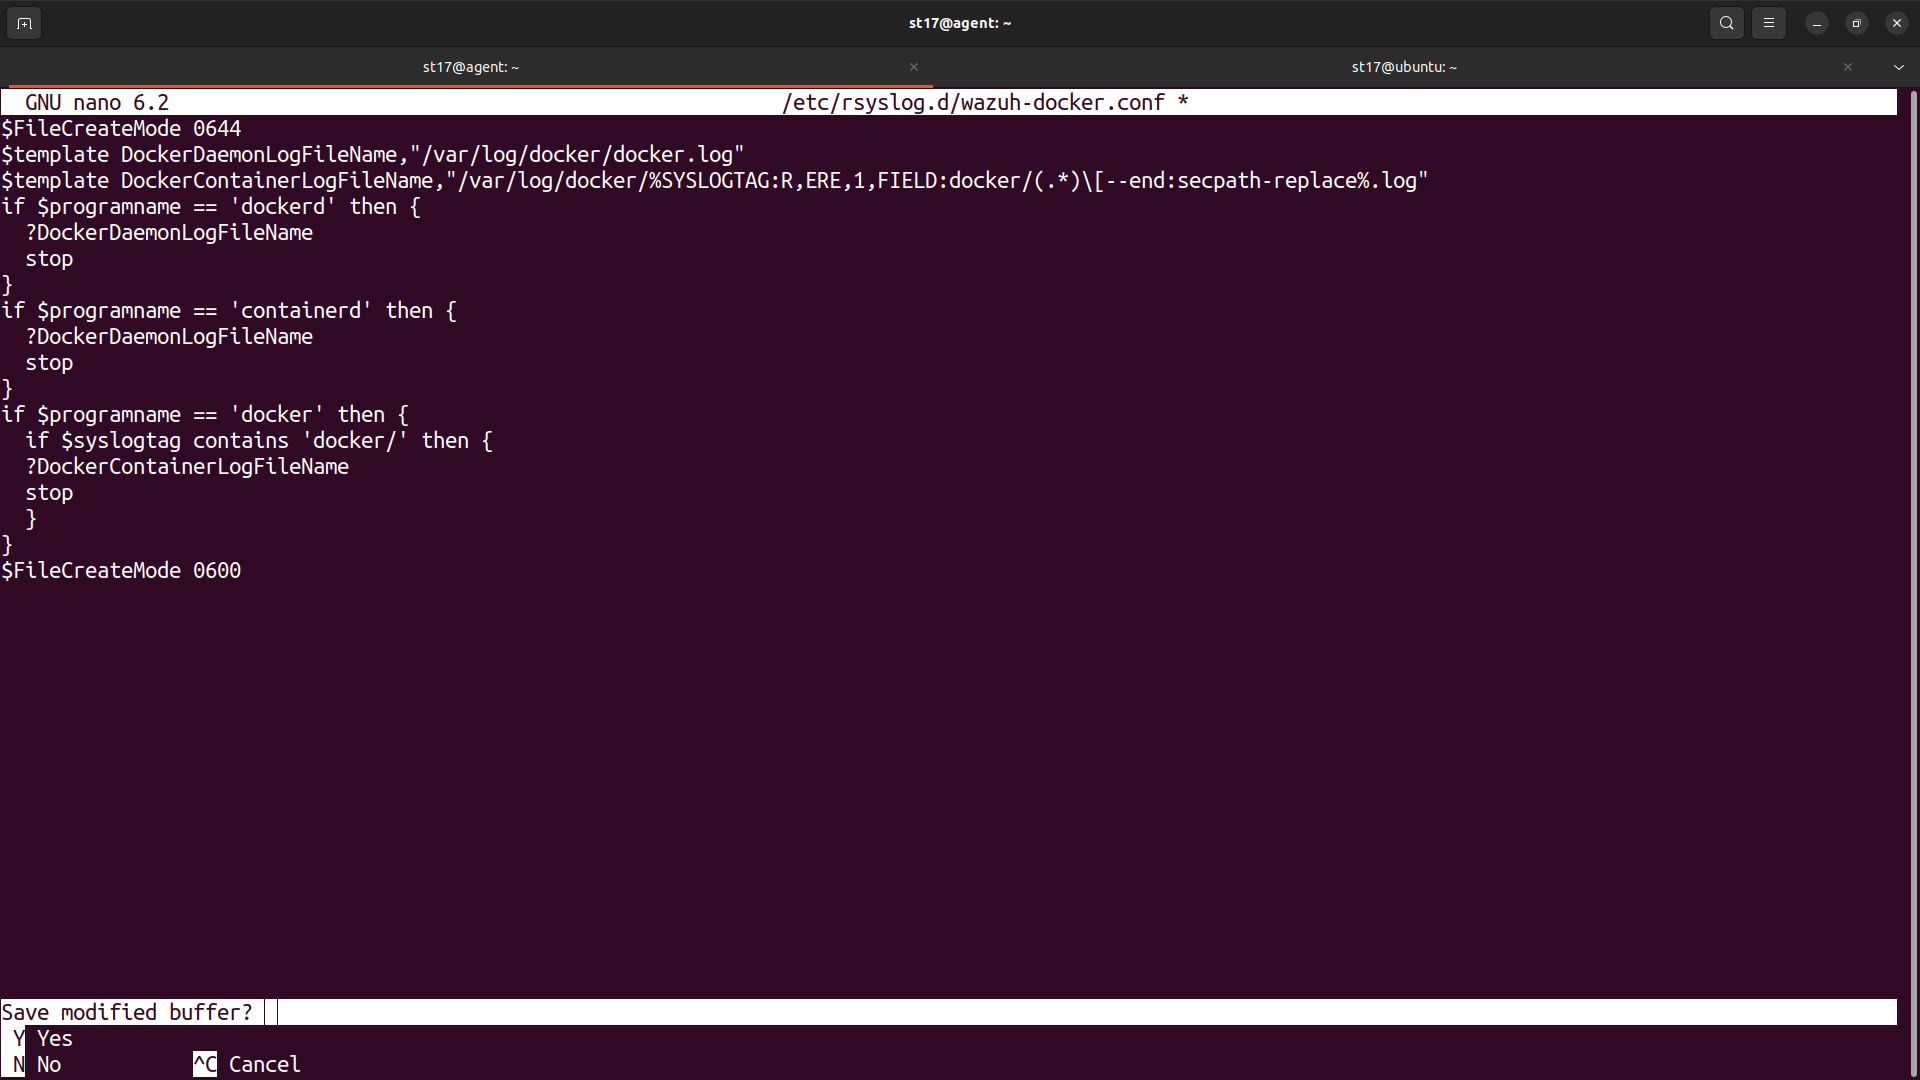
The configuration above specifies:
- The files created are in
0644mode, meaning they will be readable by all the user groups, but writable by the user only.
- That any log from dockerd, containerd, and docker runtime will be written to
/var/log/docker/docker.log.
SYSLOGTAG:R,ERE,1,FIELD:docker/(.*)\[--end:secpath-replace%is equivalent to the{{.Name}}tag in the Docker daemon configuration. Therefore new logs will be located in/var/log/docker/[new container name].log.
Restart the Rsyslog service to apply changes:
systemctl restart rsyslog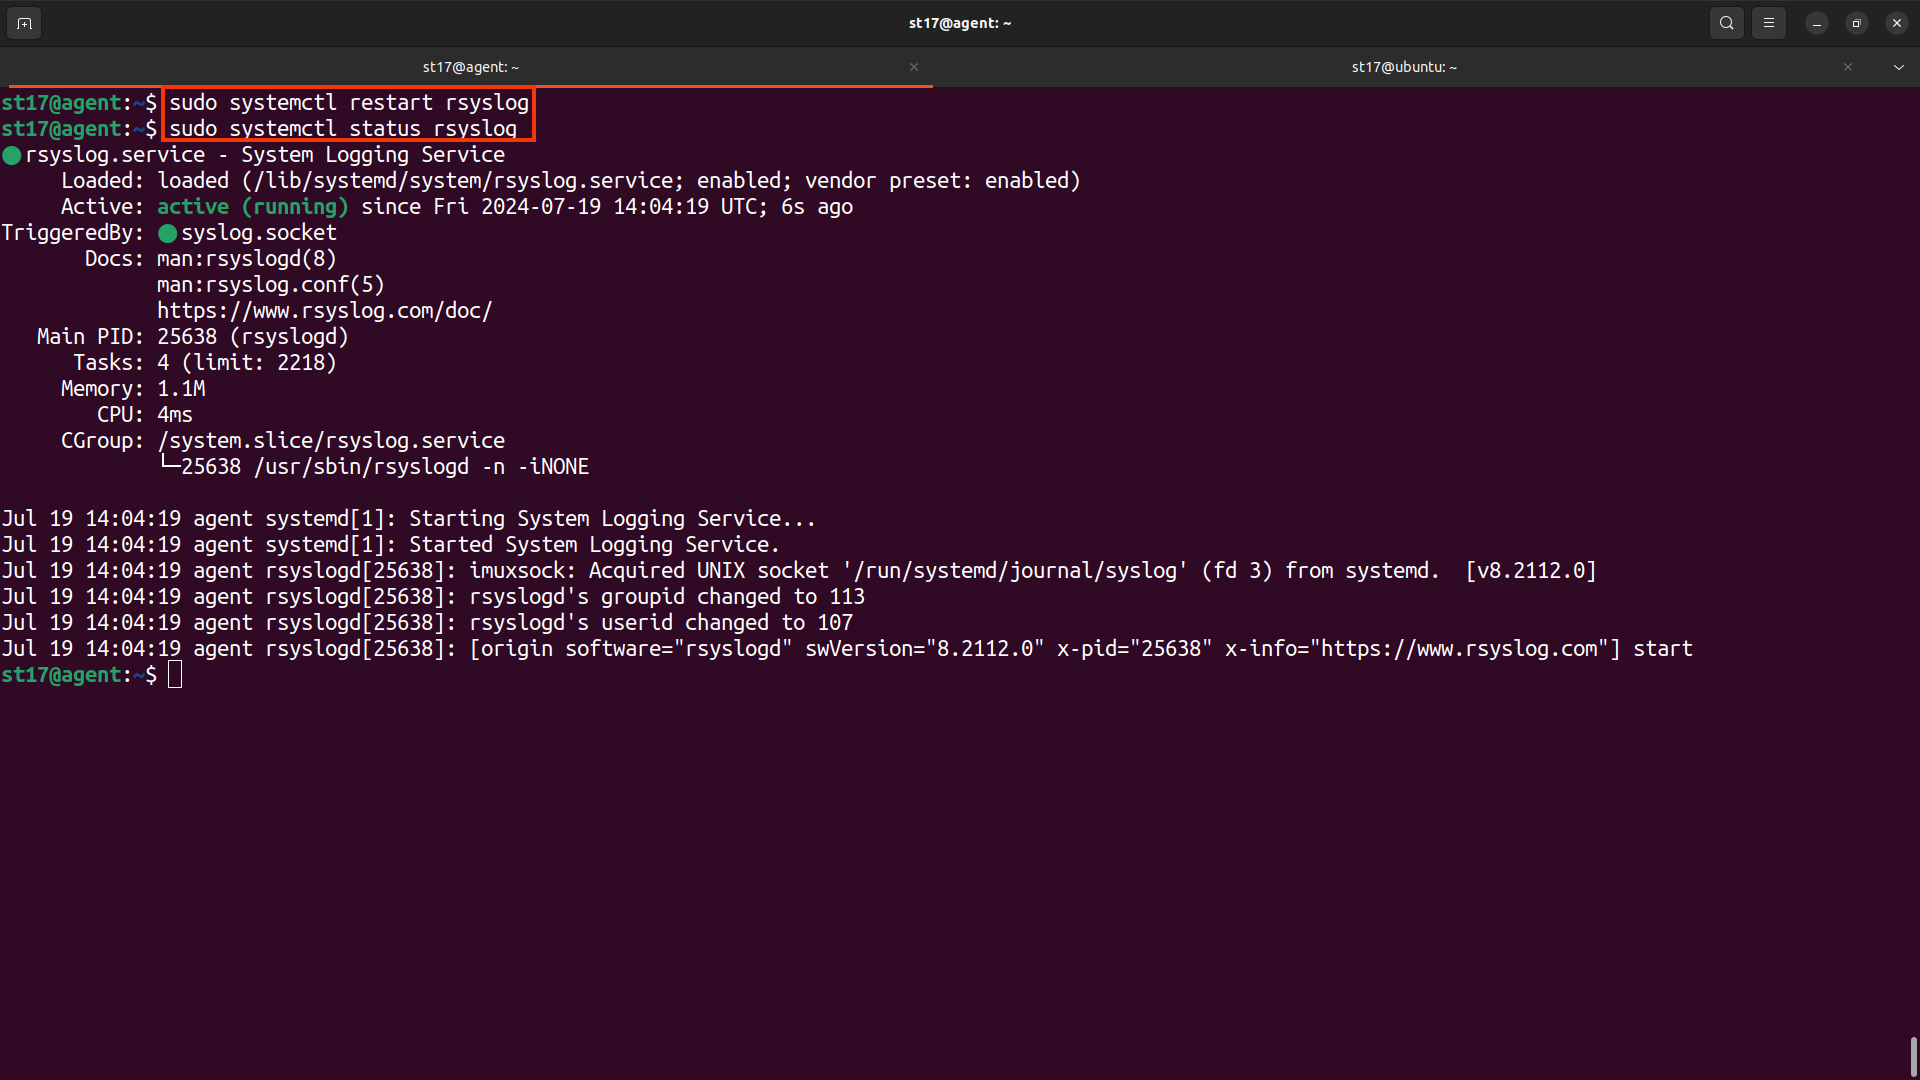
New logs should start appearing in the /var/log/docker directory when containers are created.
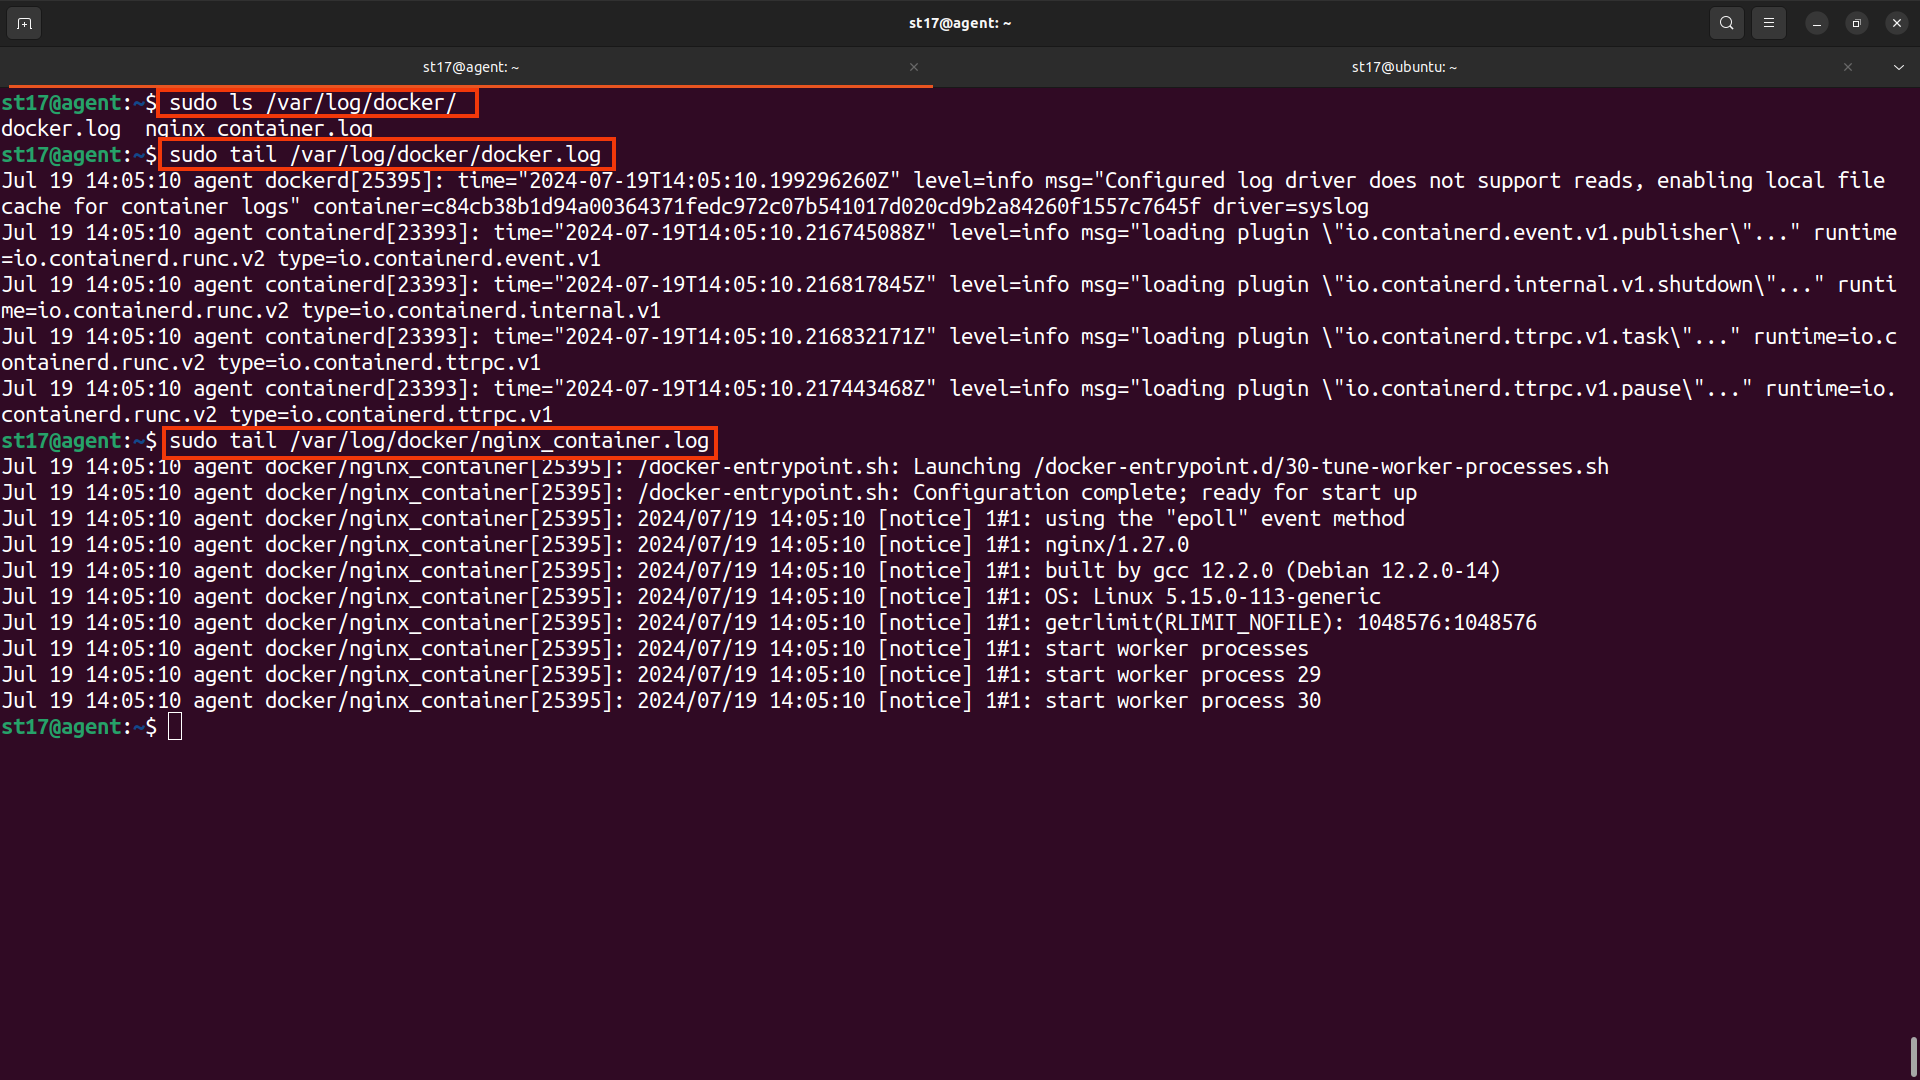
To configure log collection locally on the agent, add the configuration below inside the <ossec_config> tag of the /var/ossec/etc/ossec.conf file. A wild card is used, this way the Wazuh agent will read every container log in that directory:
<localfile>
  <log_format>syslog</log_format>
  <location>/var/log/docker/*</location>
</localfile>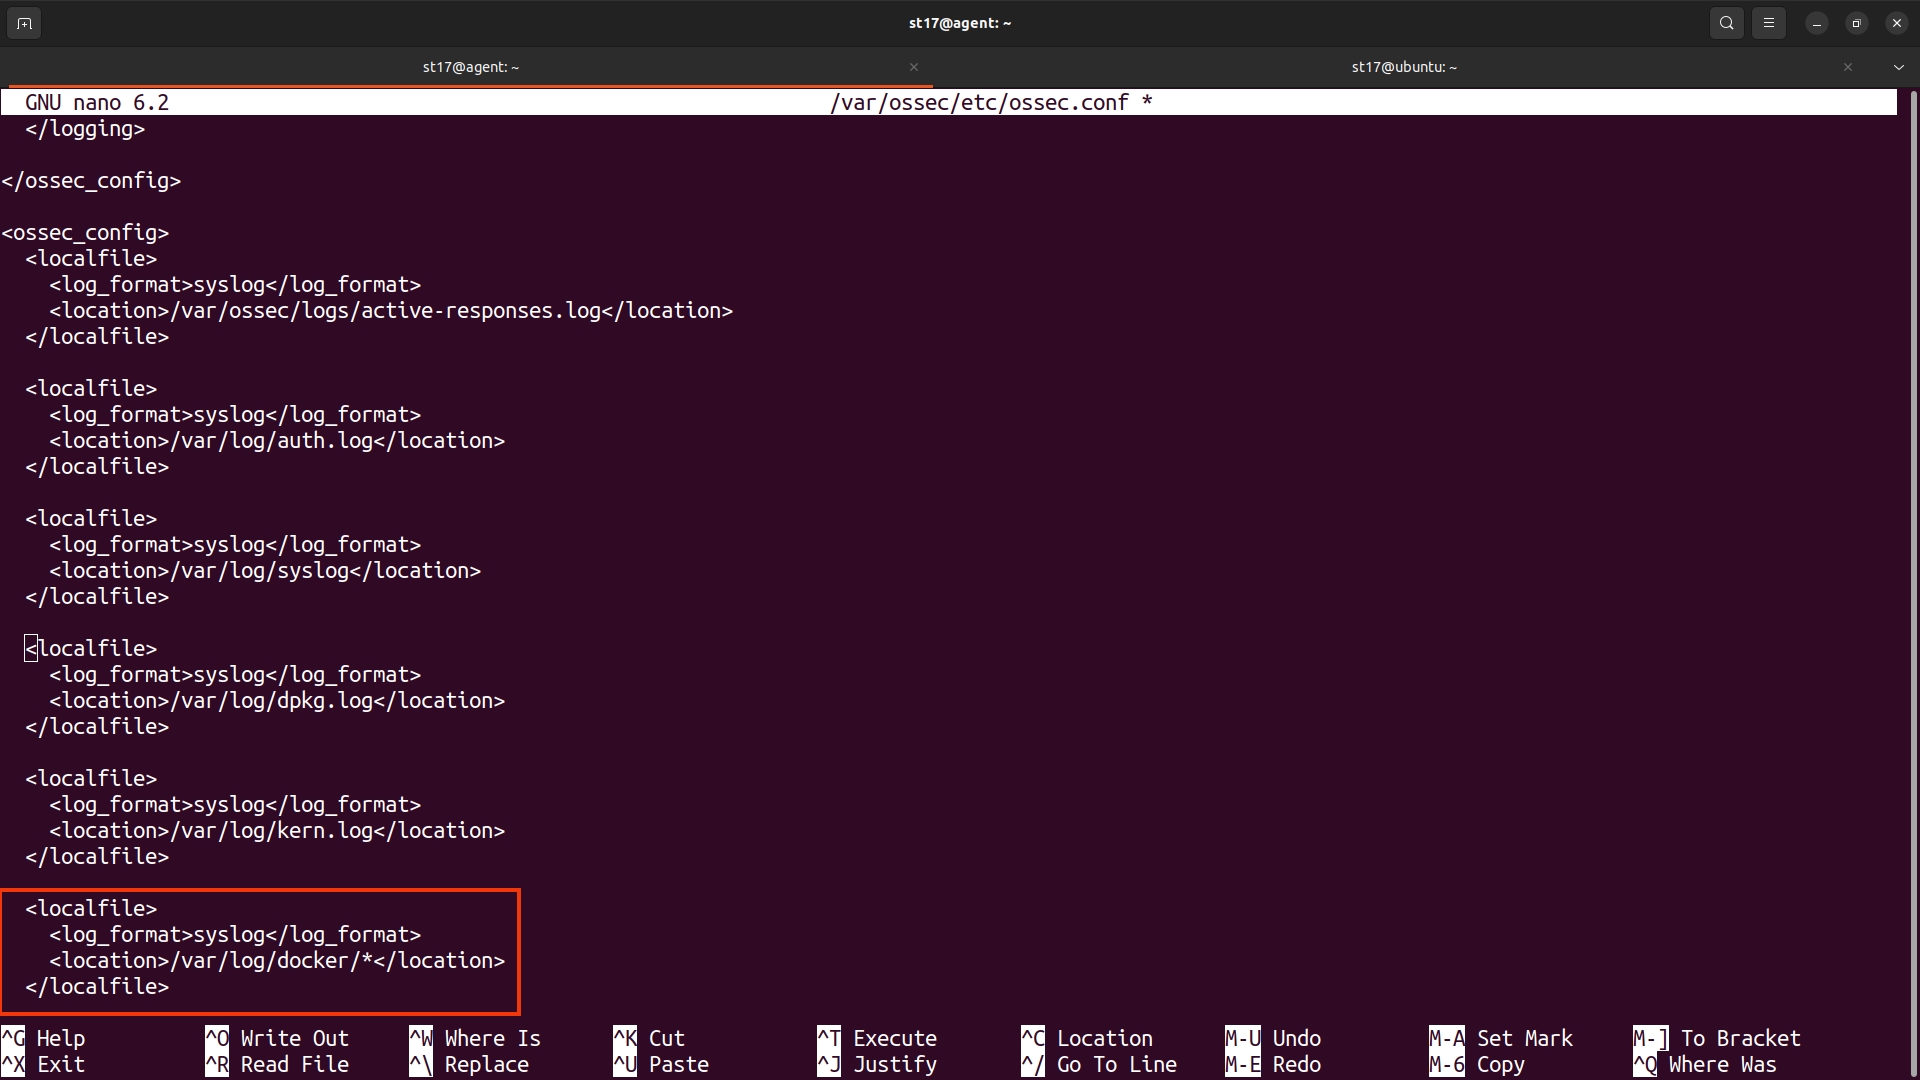
Restart the Wazuh agent for changes to apply:
systemctl restart wazuh-agent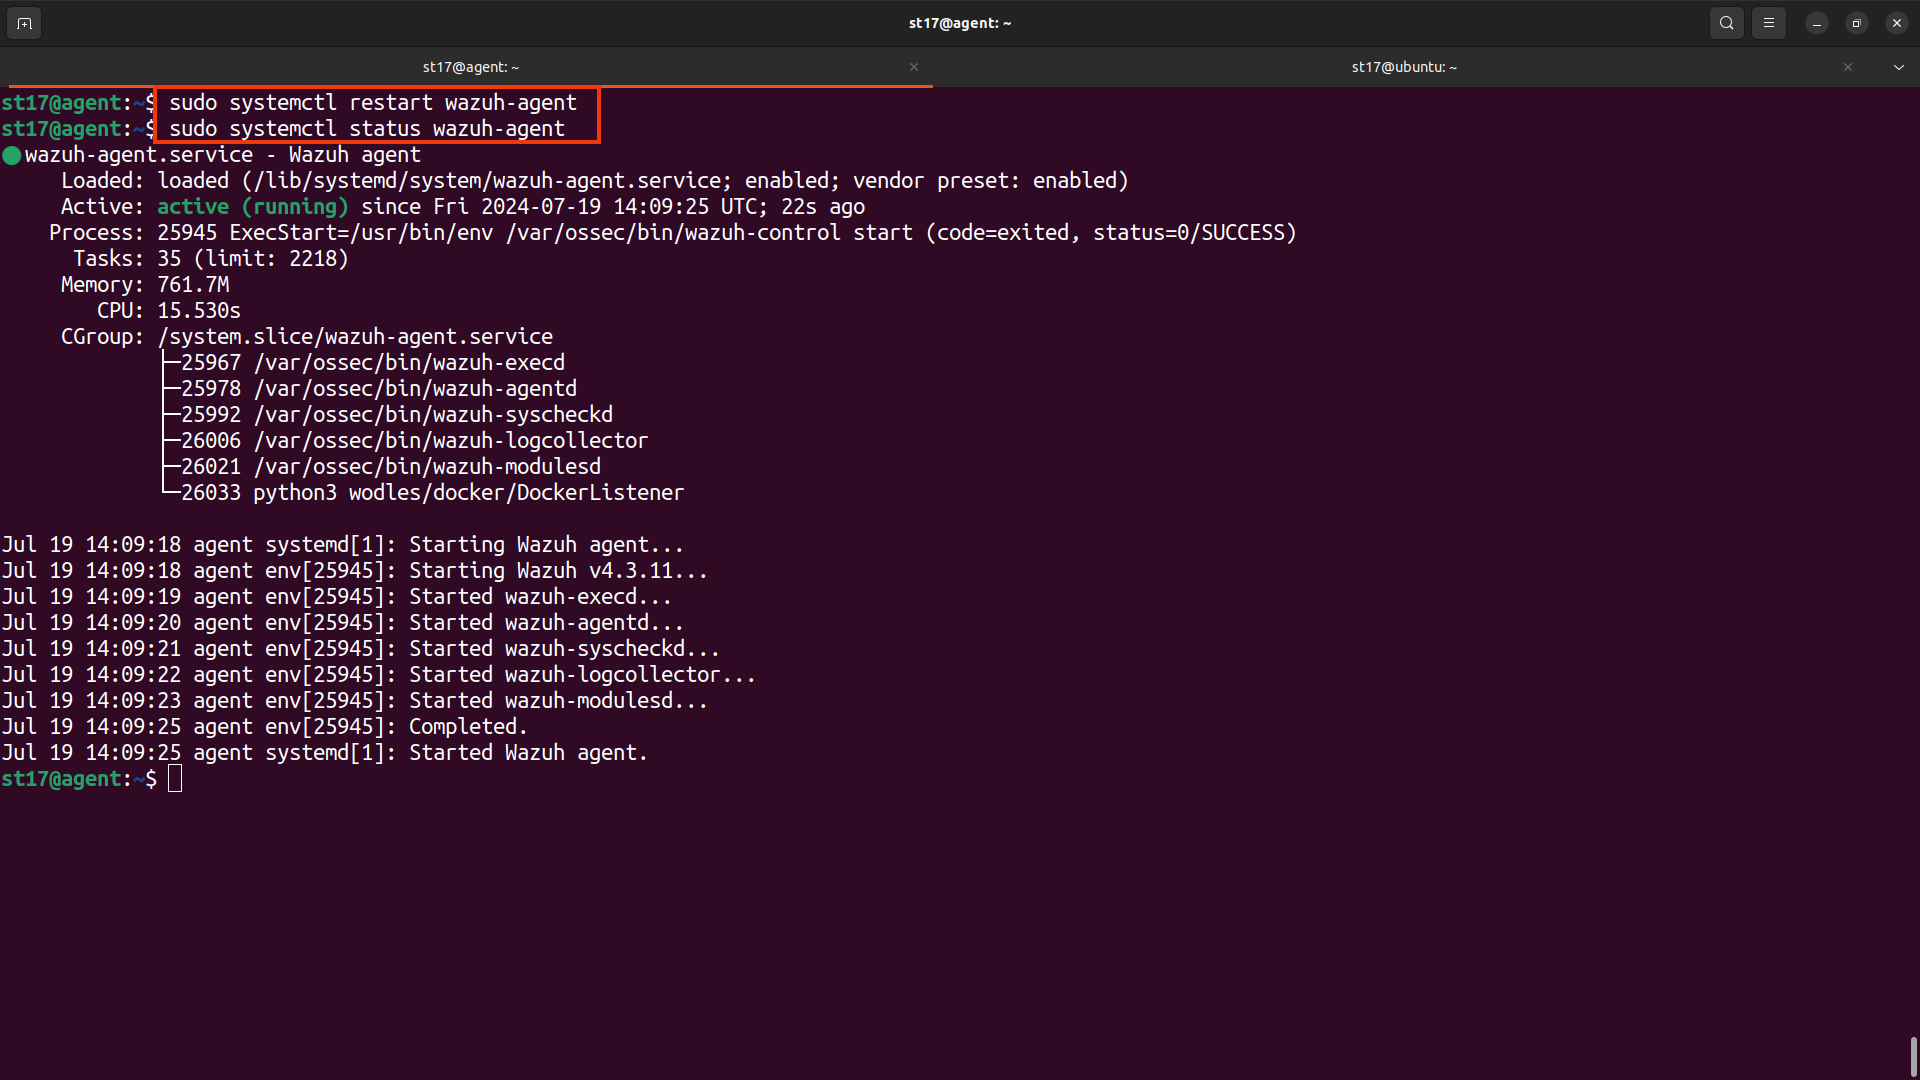
As mentioned earlier, non-interactive applications produce additional logs, depending on the design of the container. For example, a web server container will generate web logs. So we expect to see HTTP web requests like GET in the logs.
Let’s set up a simple web server that shows its hostname, IP address, and other information:
- Create a container using the
nginxdemos/hellocontainer image. Setting the container name is important for Rsyslog to tag the log:docker run -P -d --hostname webserver --name webserver nginxdemos/hello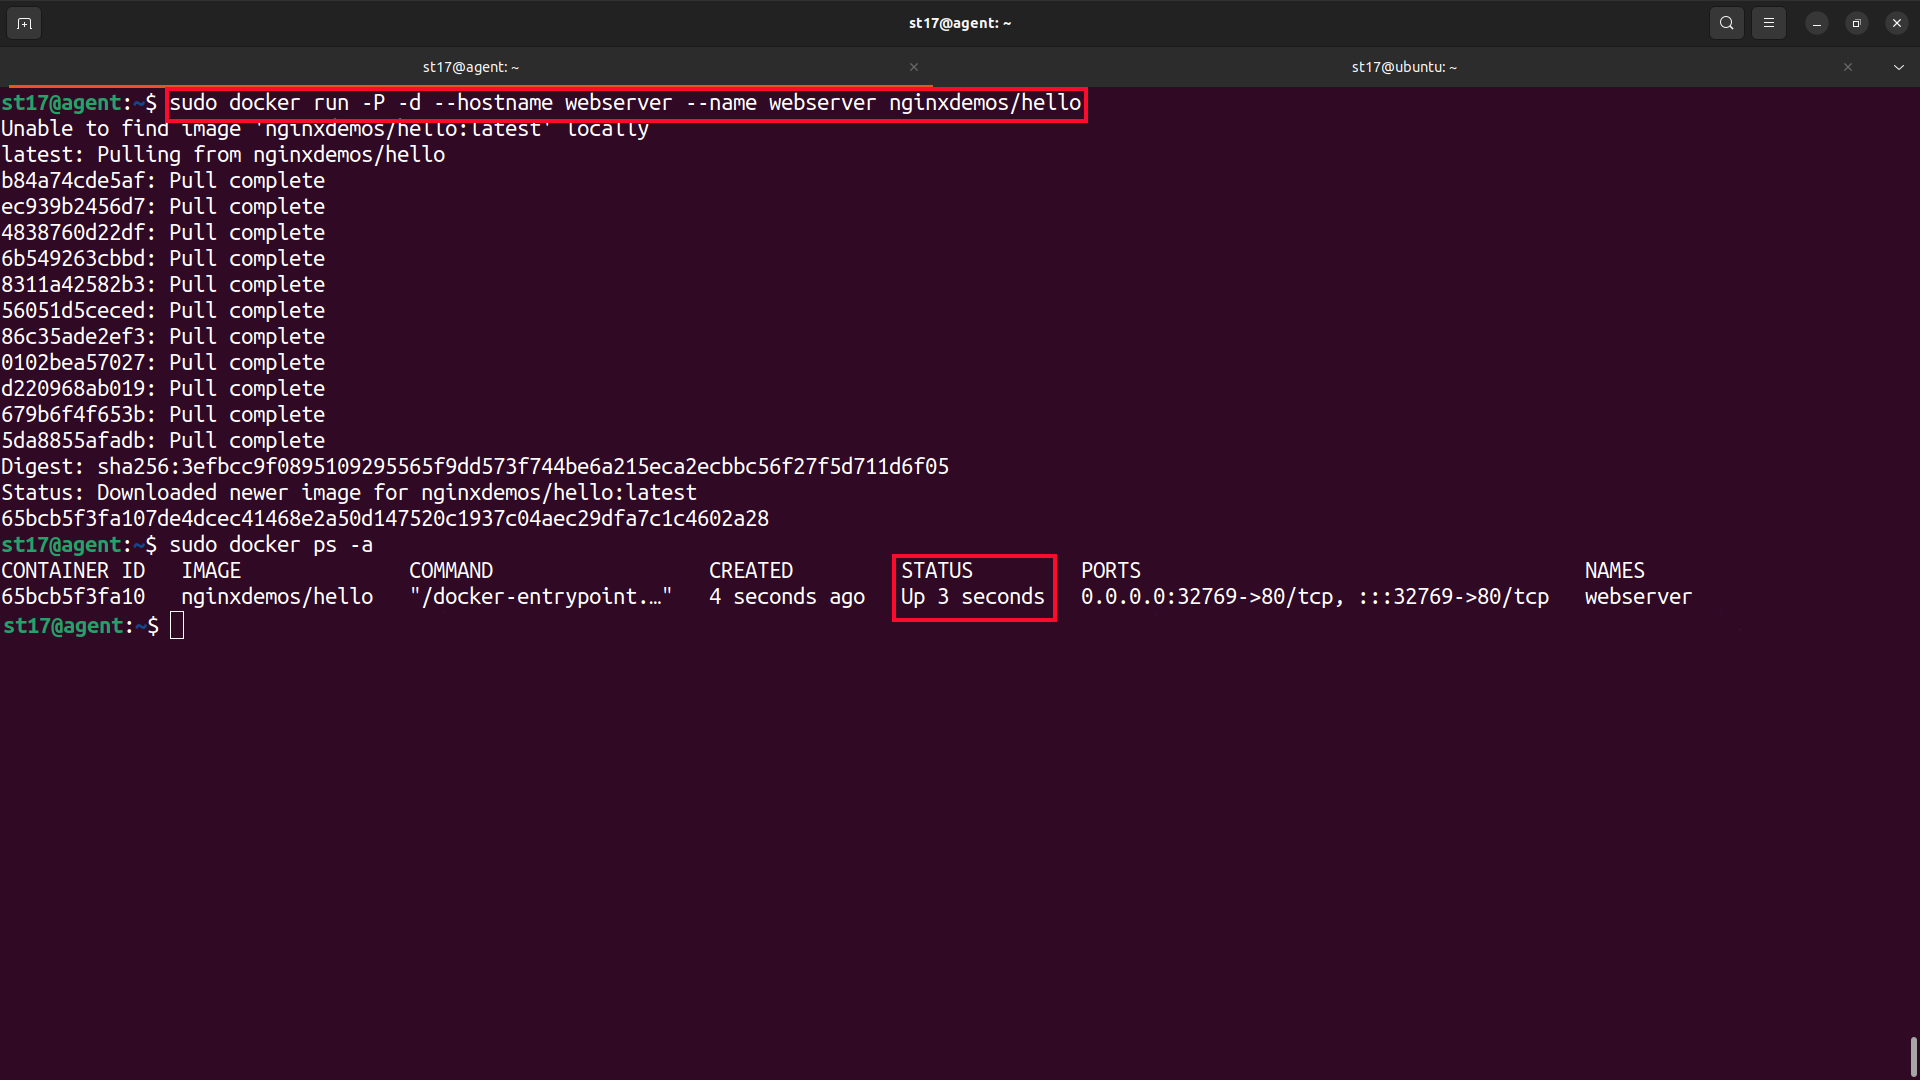
- Check that there is a new log file:
ls /var/log/docker/webserver.log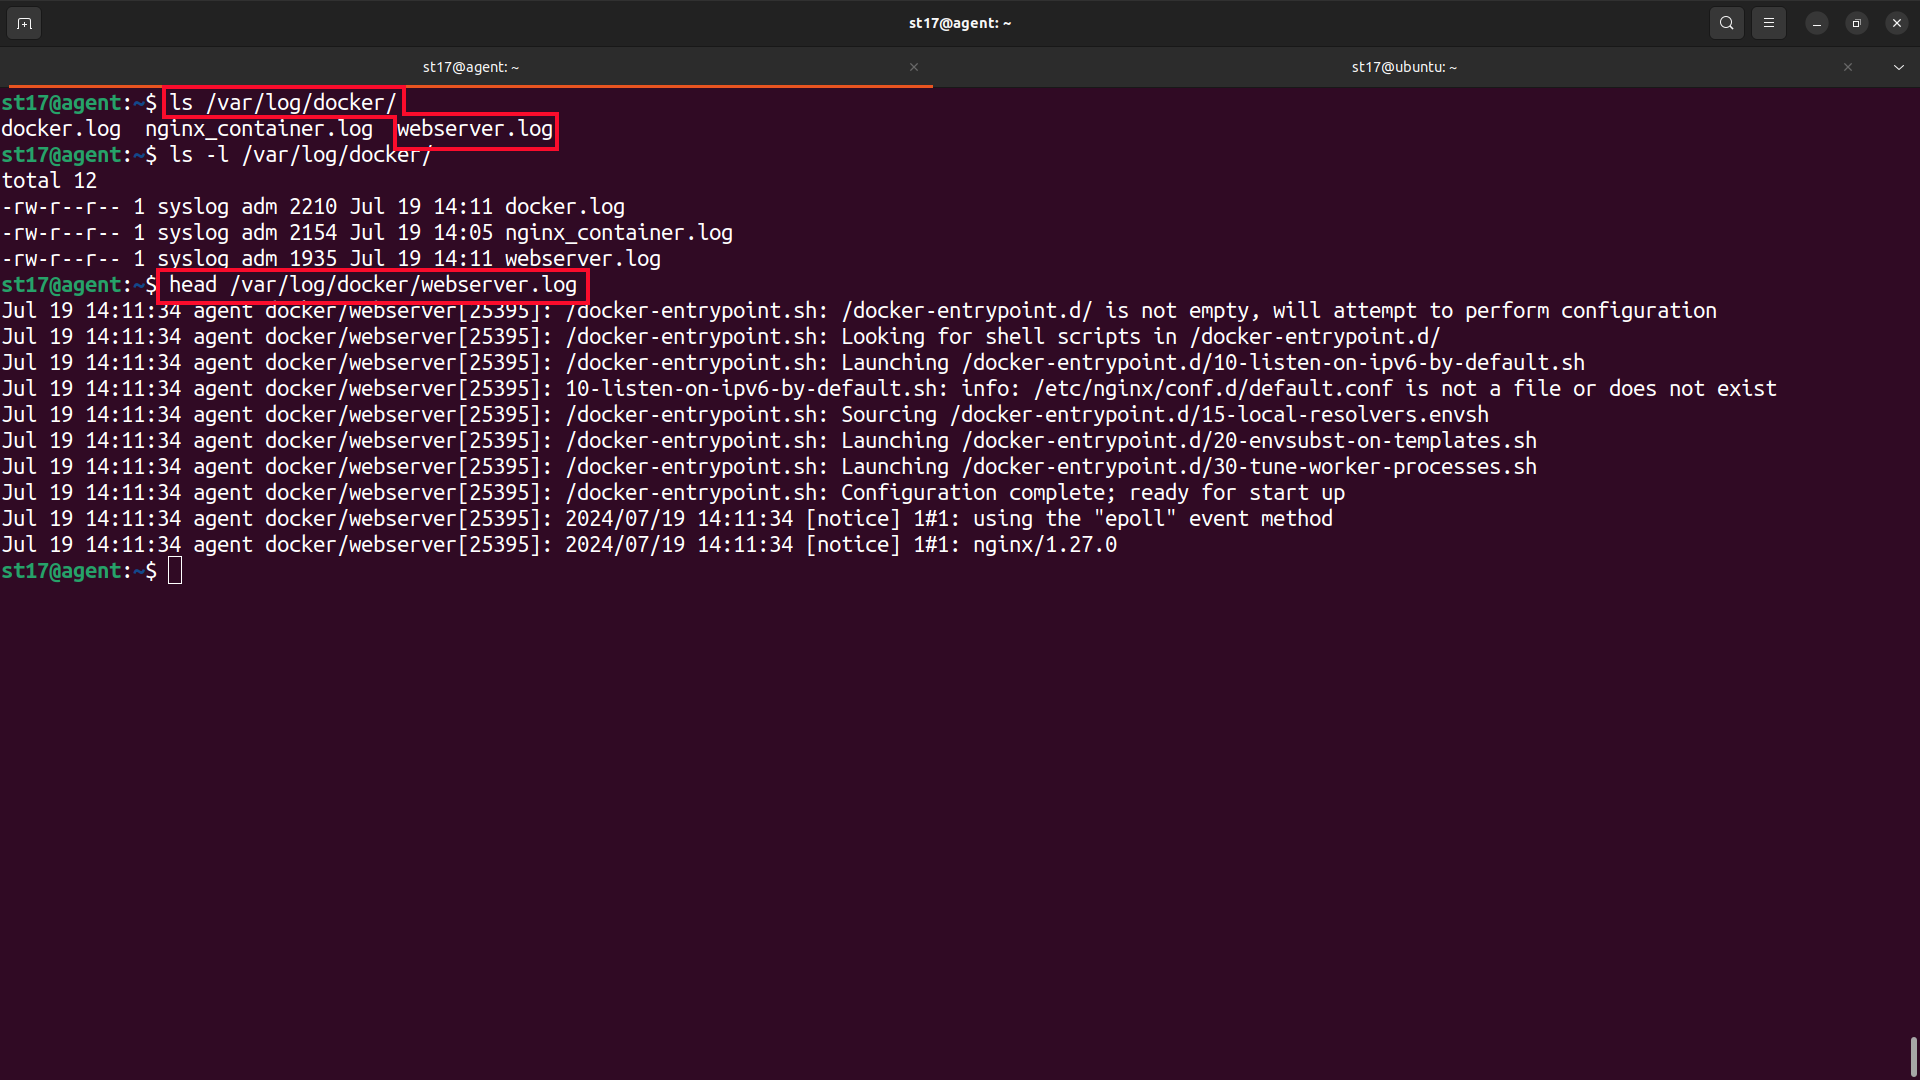
Configure the manager to store events collected by the agent to /var/ossec/logs/archives/archives.json file. These logs will be used to create rules and decoders. In the /var/ossec/etc/ossec.conf file, change <logall_json> to yes. Later when rules are being triggered, we change <logall_json> back to no. This way large volumes of logs are not stored on the manager side:
<logall_json>yes</logall_json>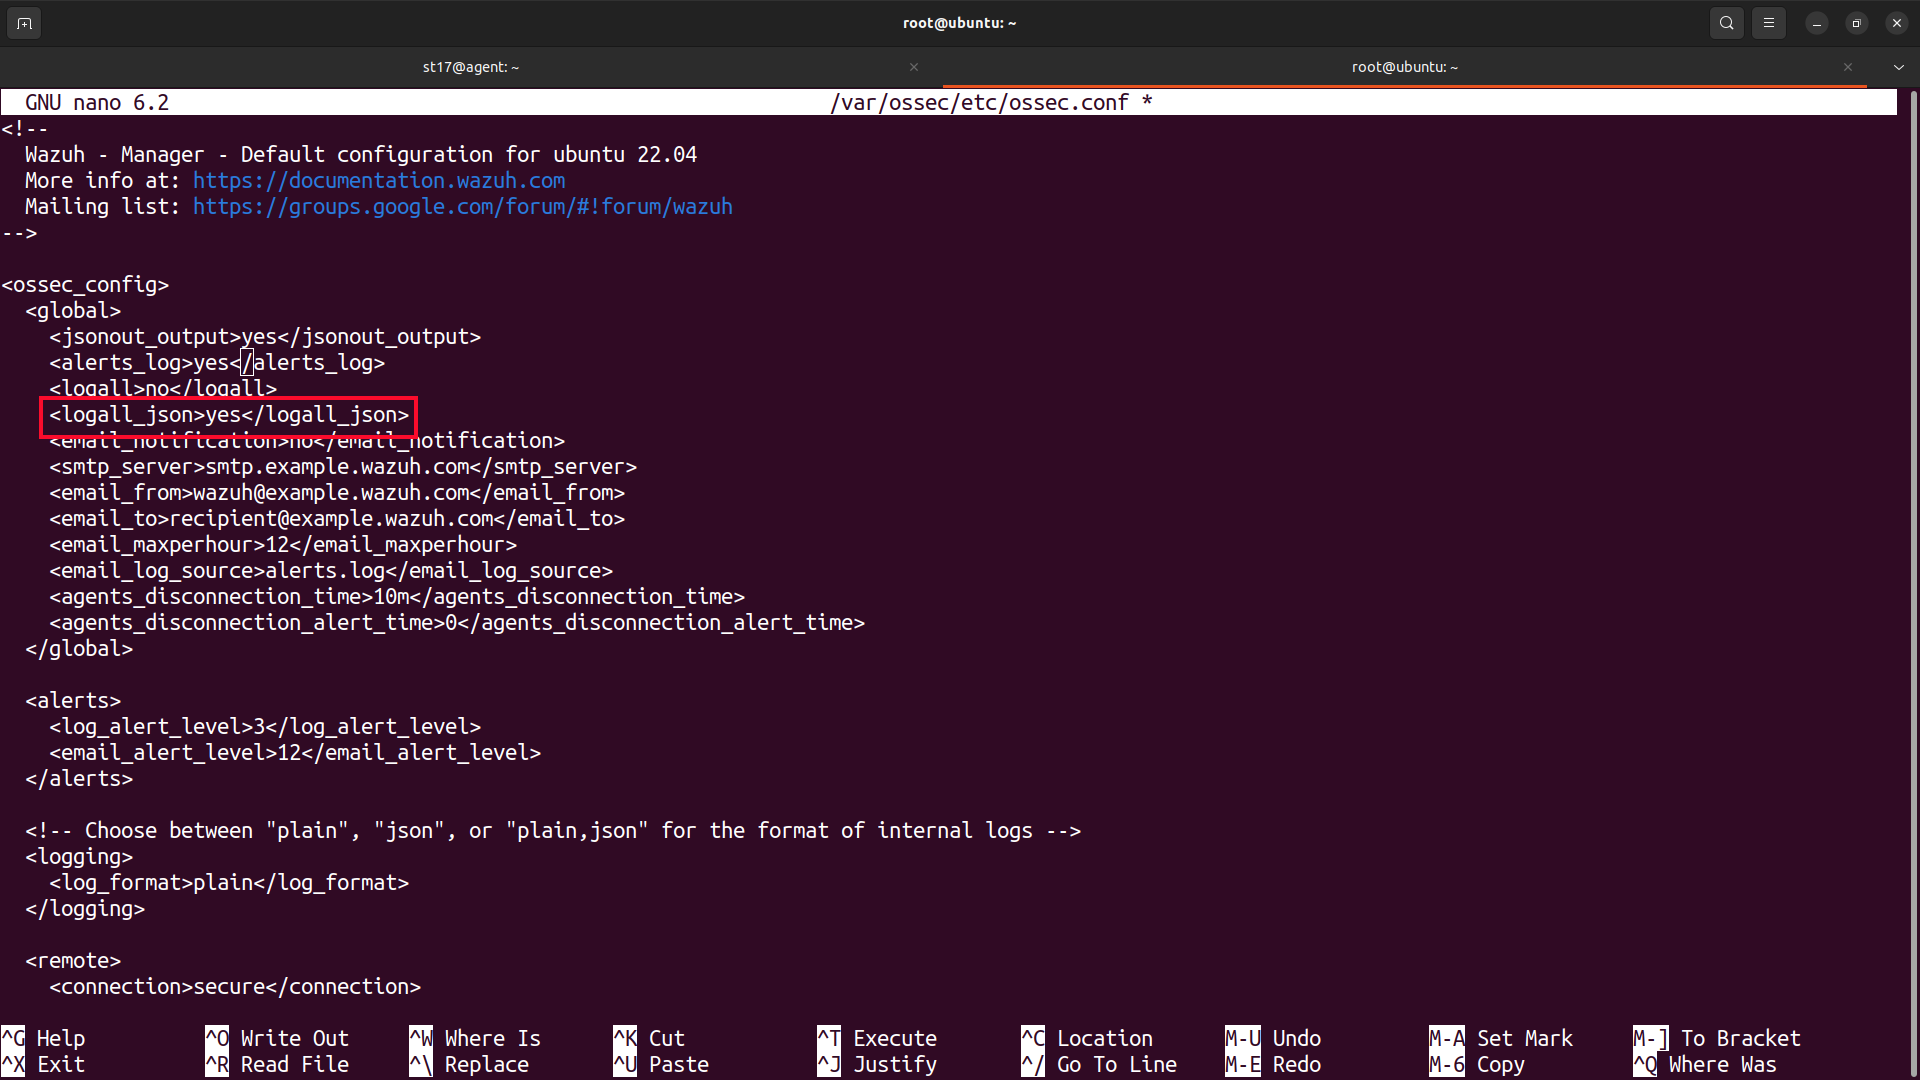
Restart the Wazuh manager for changes to apply:
systemctl restart wazuh-manager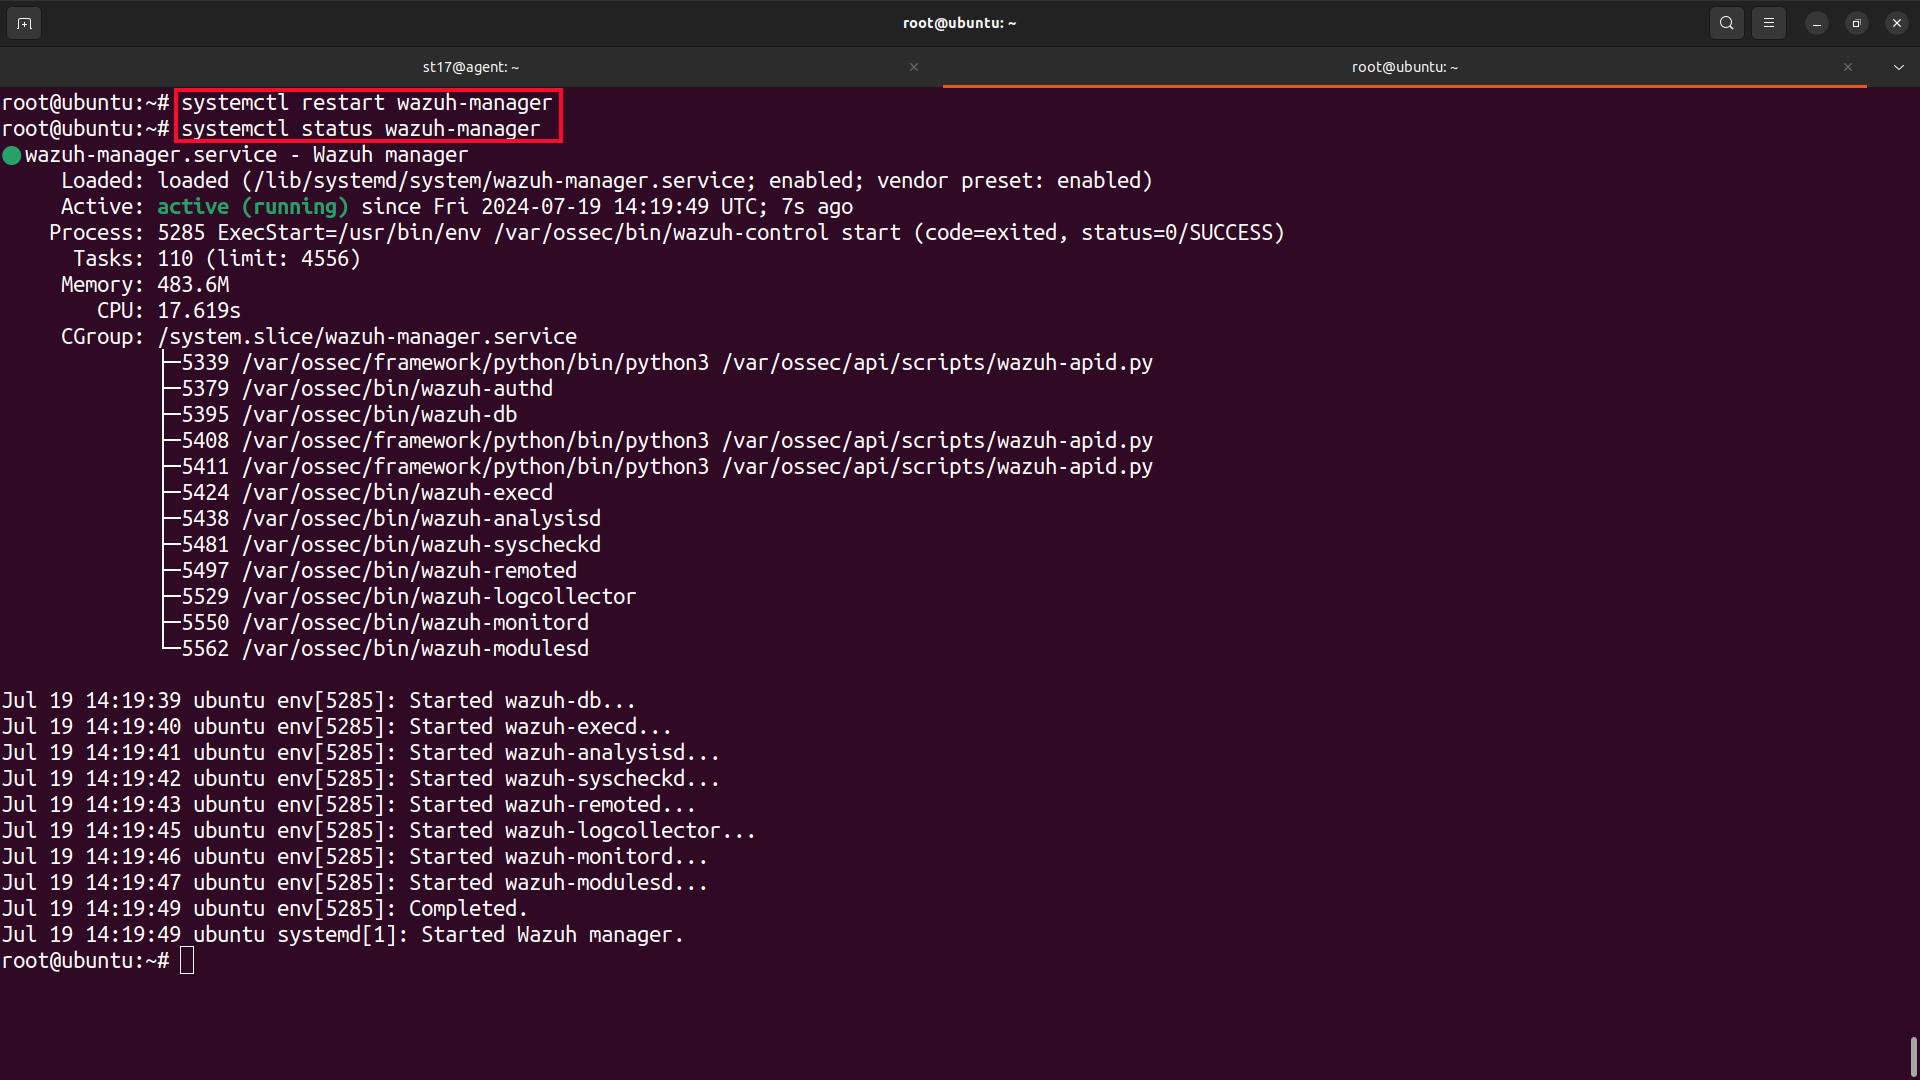
On the Linux/Unix endpoint, get the IP address of the web server container:
docker inspect webserver | grep IPAddress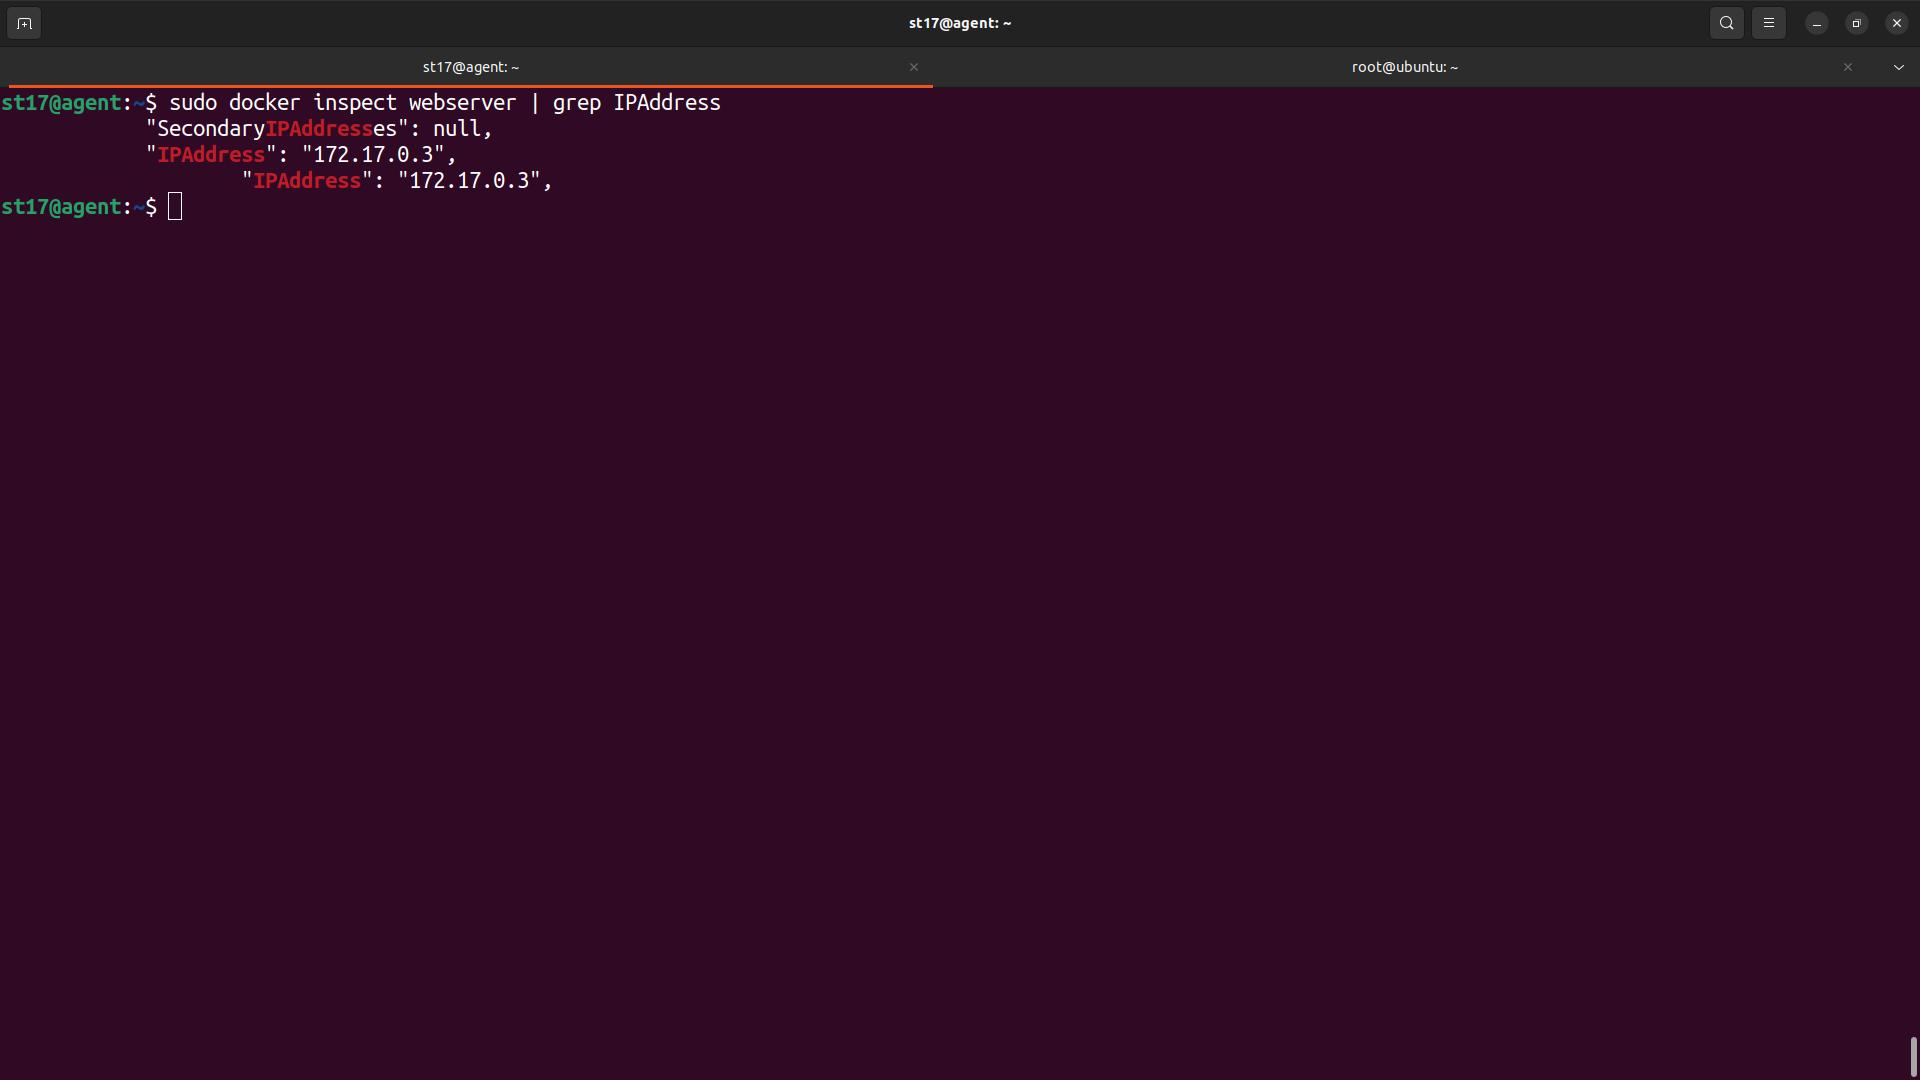
On the Wazuh manager, check that it can see the container logs after a curl request is made:
tail -f /var/ossec/logs/archives/archives.json | grep webserver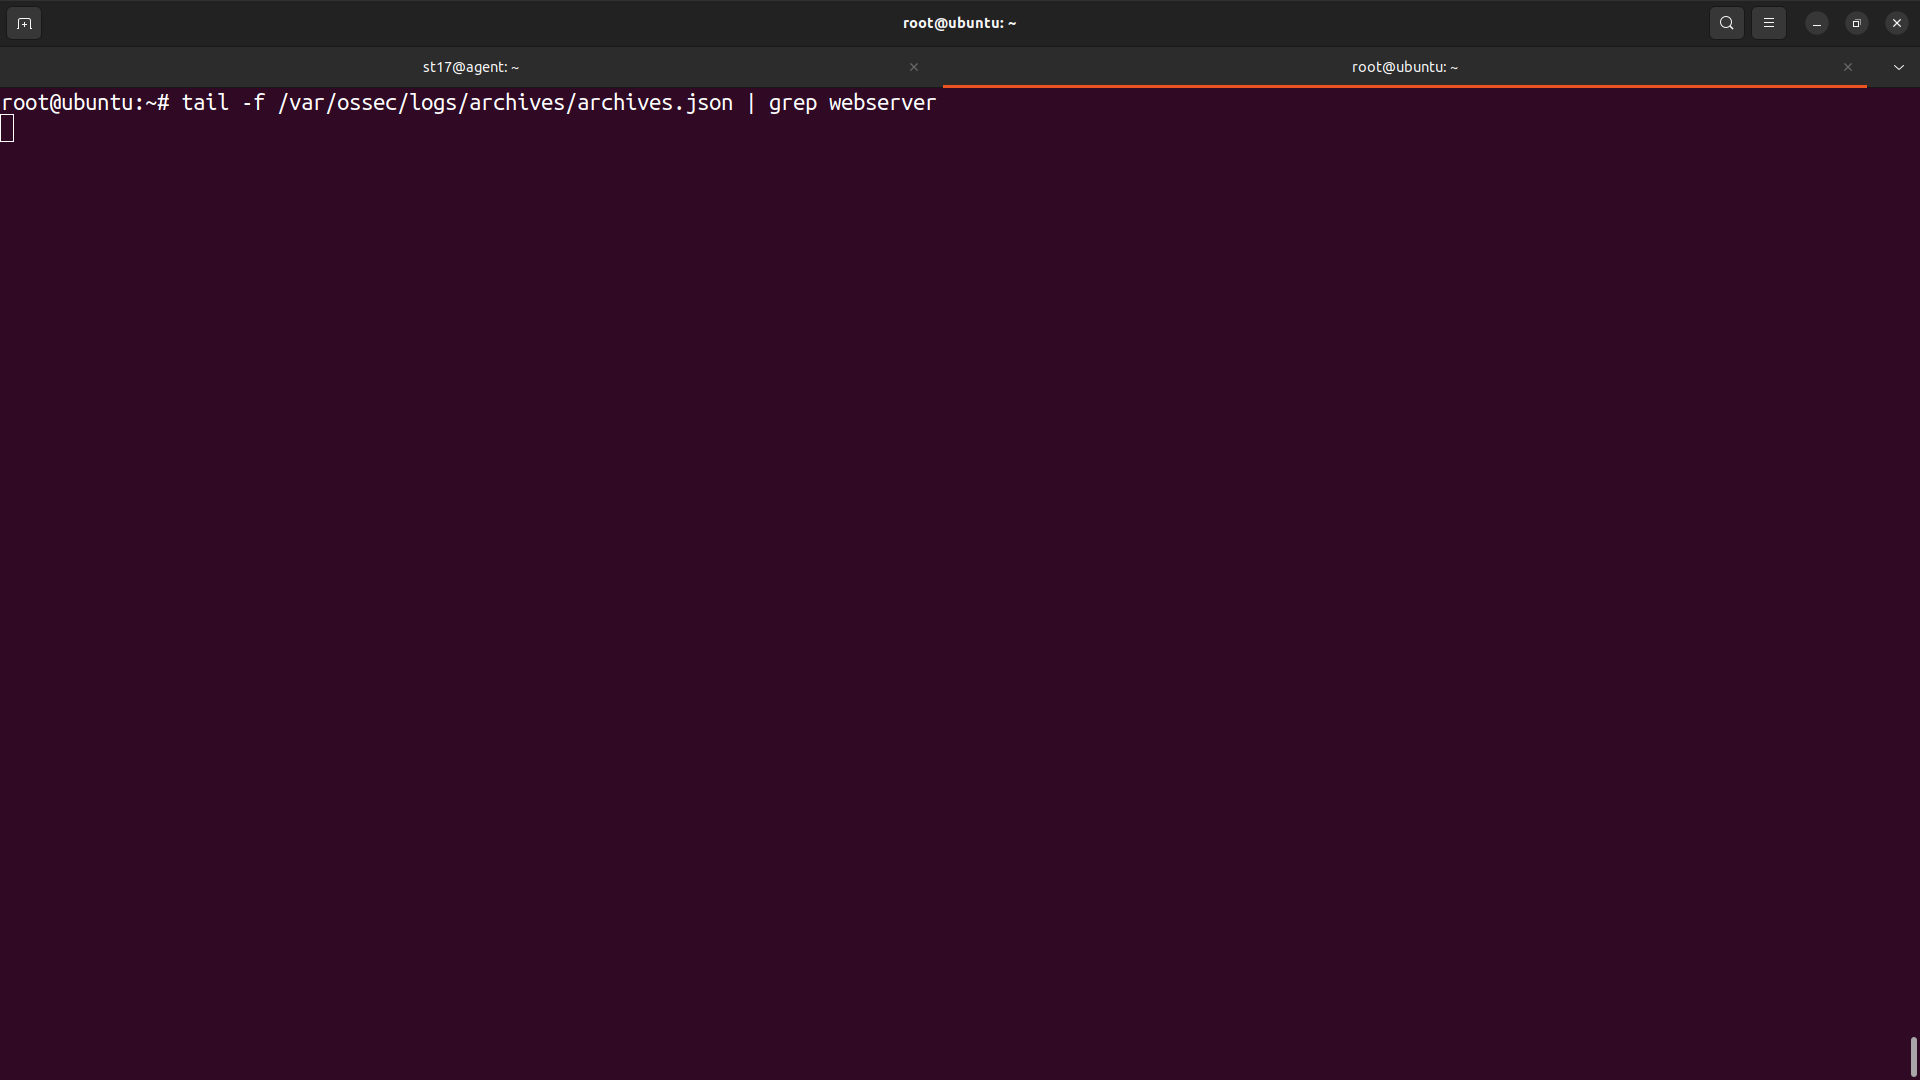
From a machine that can reach the web server, do a curl request or browse to the web server container IP address:
curl <webserver_IP>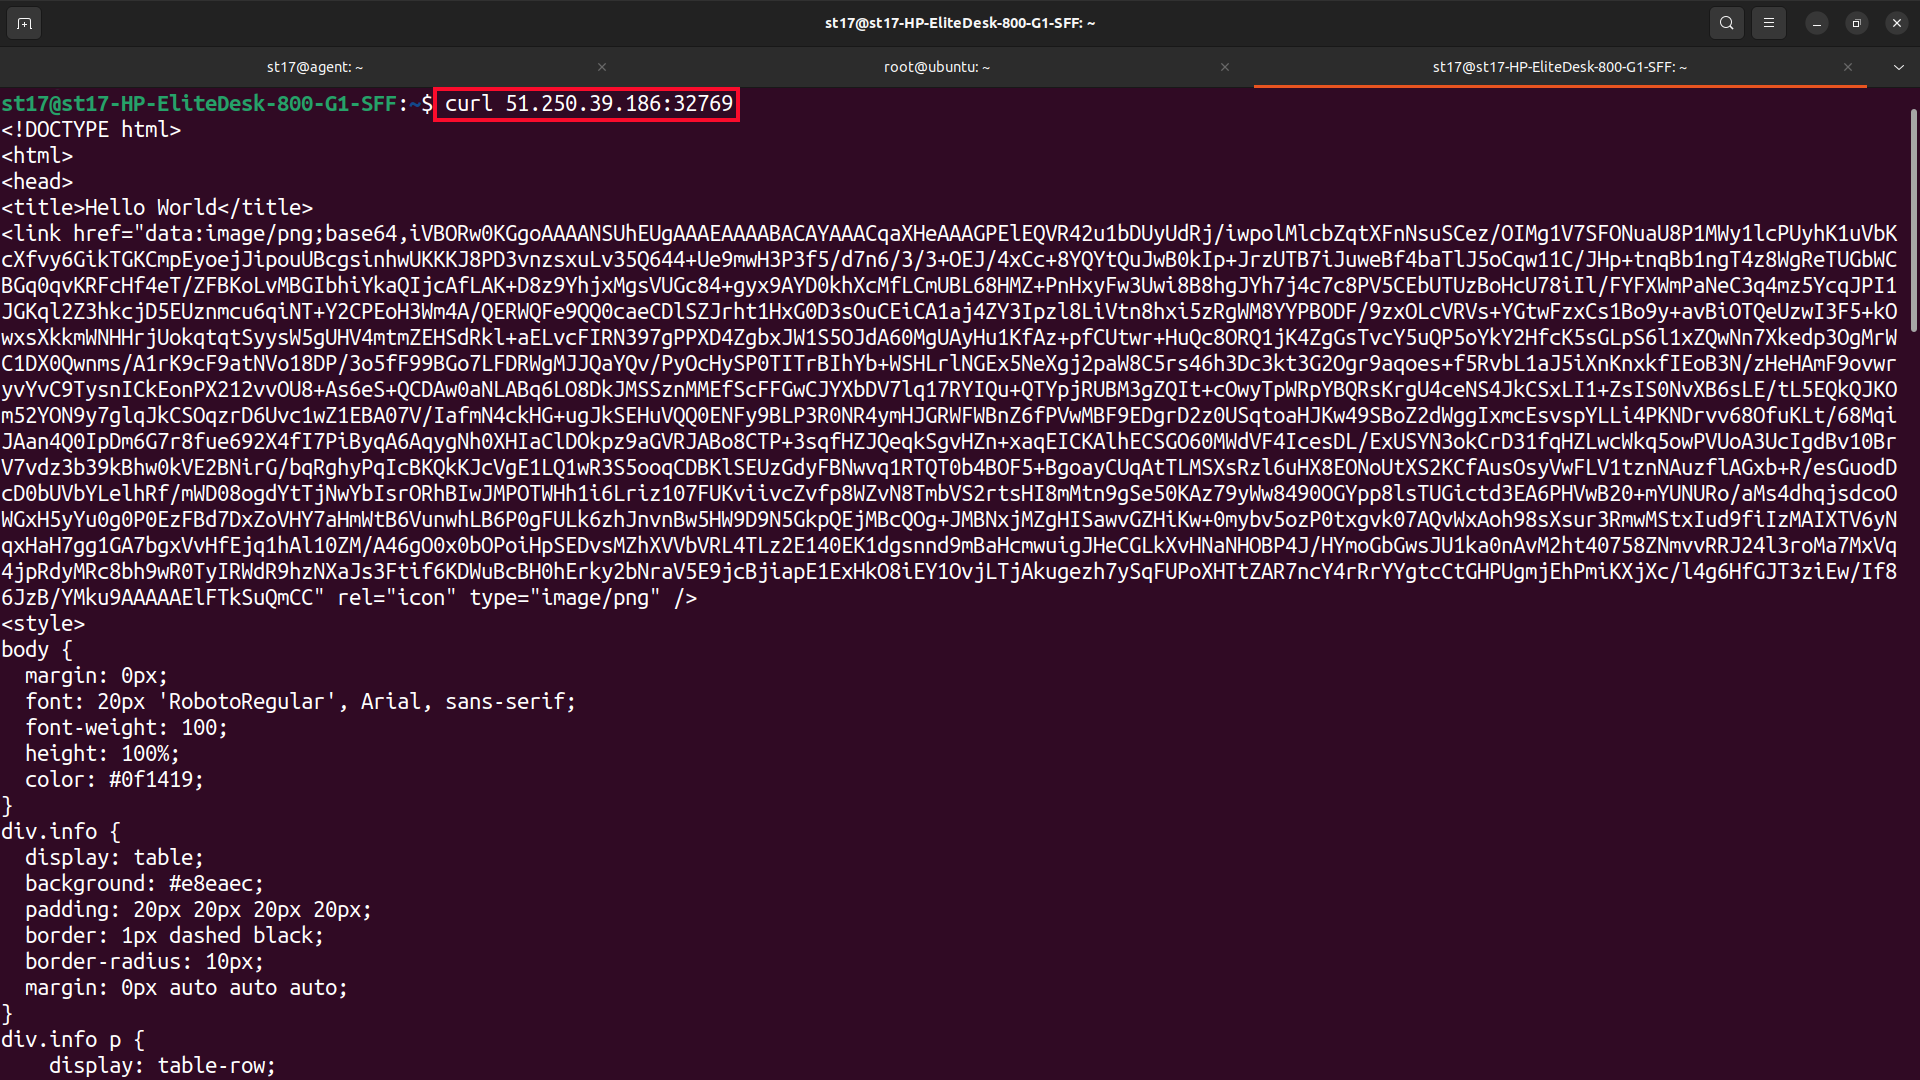
The curl request creates an event that is logged to the Wazuh manager archives:
{"timestamp":"2022-02-02T11:53:33.058+0000","agent":{"id":"025","name":"vagrant","ip":"10.0.2.15"},"manager":{"name":"wazuh-manager"},"id":"1643802813.1121072","full_log":"Feb 2 11:53:32 vagrant docker/webserver[24403]: 172.17.0.1 - - [02/Feb/2022:11:53:32 +0000] \"GET / HTTP/1.1\" 200 7228 \"-\" \"curl/7.58.0\" \"-\"","predecoder":{"program_name":"docker/webserver","timestamp":"Feb 2 11:53:32","hostname":"vagrant"},"decoder":{"name":"docker_log_decoder"},"data":{"srcip":"172.17.0.1","date":"02/Feb/2022","time":"2022:11:53","web_action":"\"GET / HTTP/1.1\" 200"},"location":"/var/log/syslog"}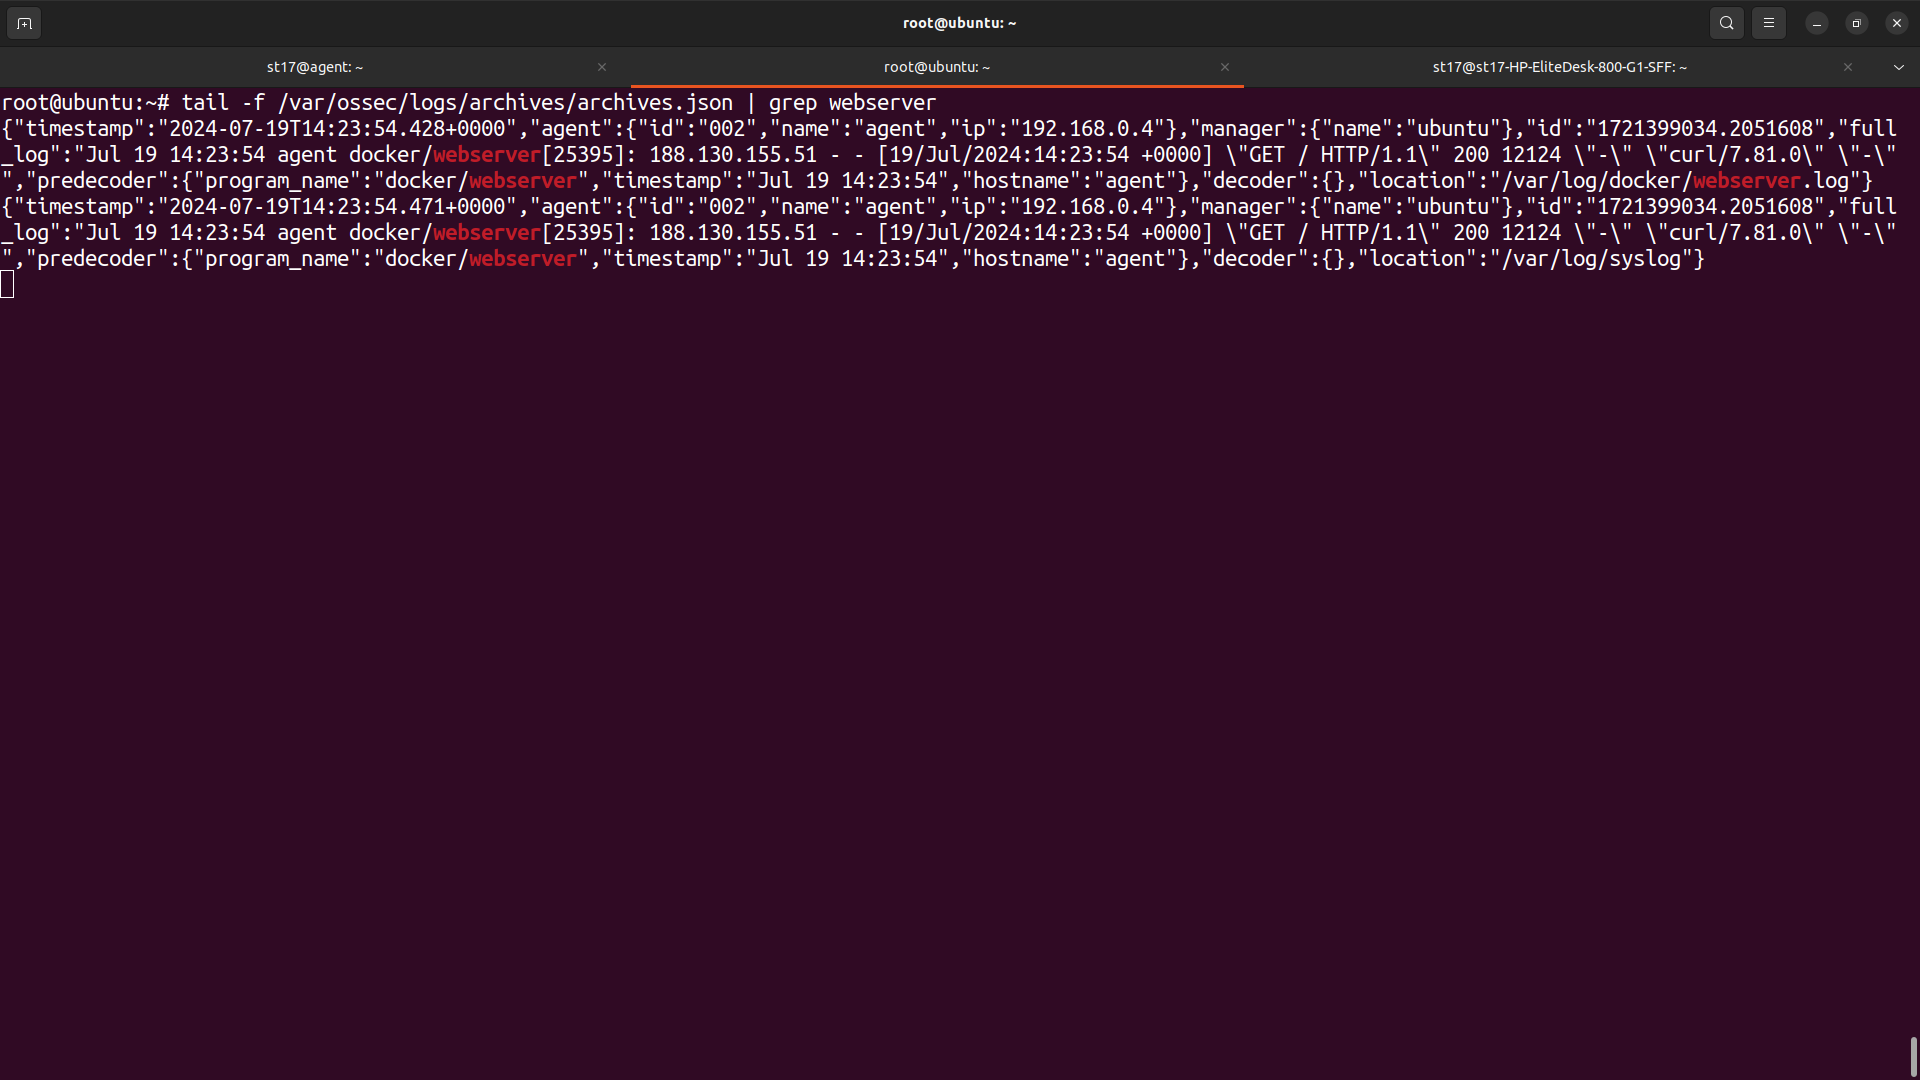
The container logs are in the full_log field in the log above. This is the log of interest:
Feb 2 11:53:32 vagrant docker/webserver[24403]: 172.17.0.1 - - [02/Feb/2022:11:53:32 +0000] "GET / HTTP/1.1" 200 7228 "-" "curl/7.58.0" "-"'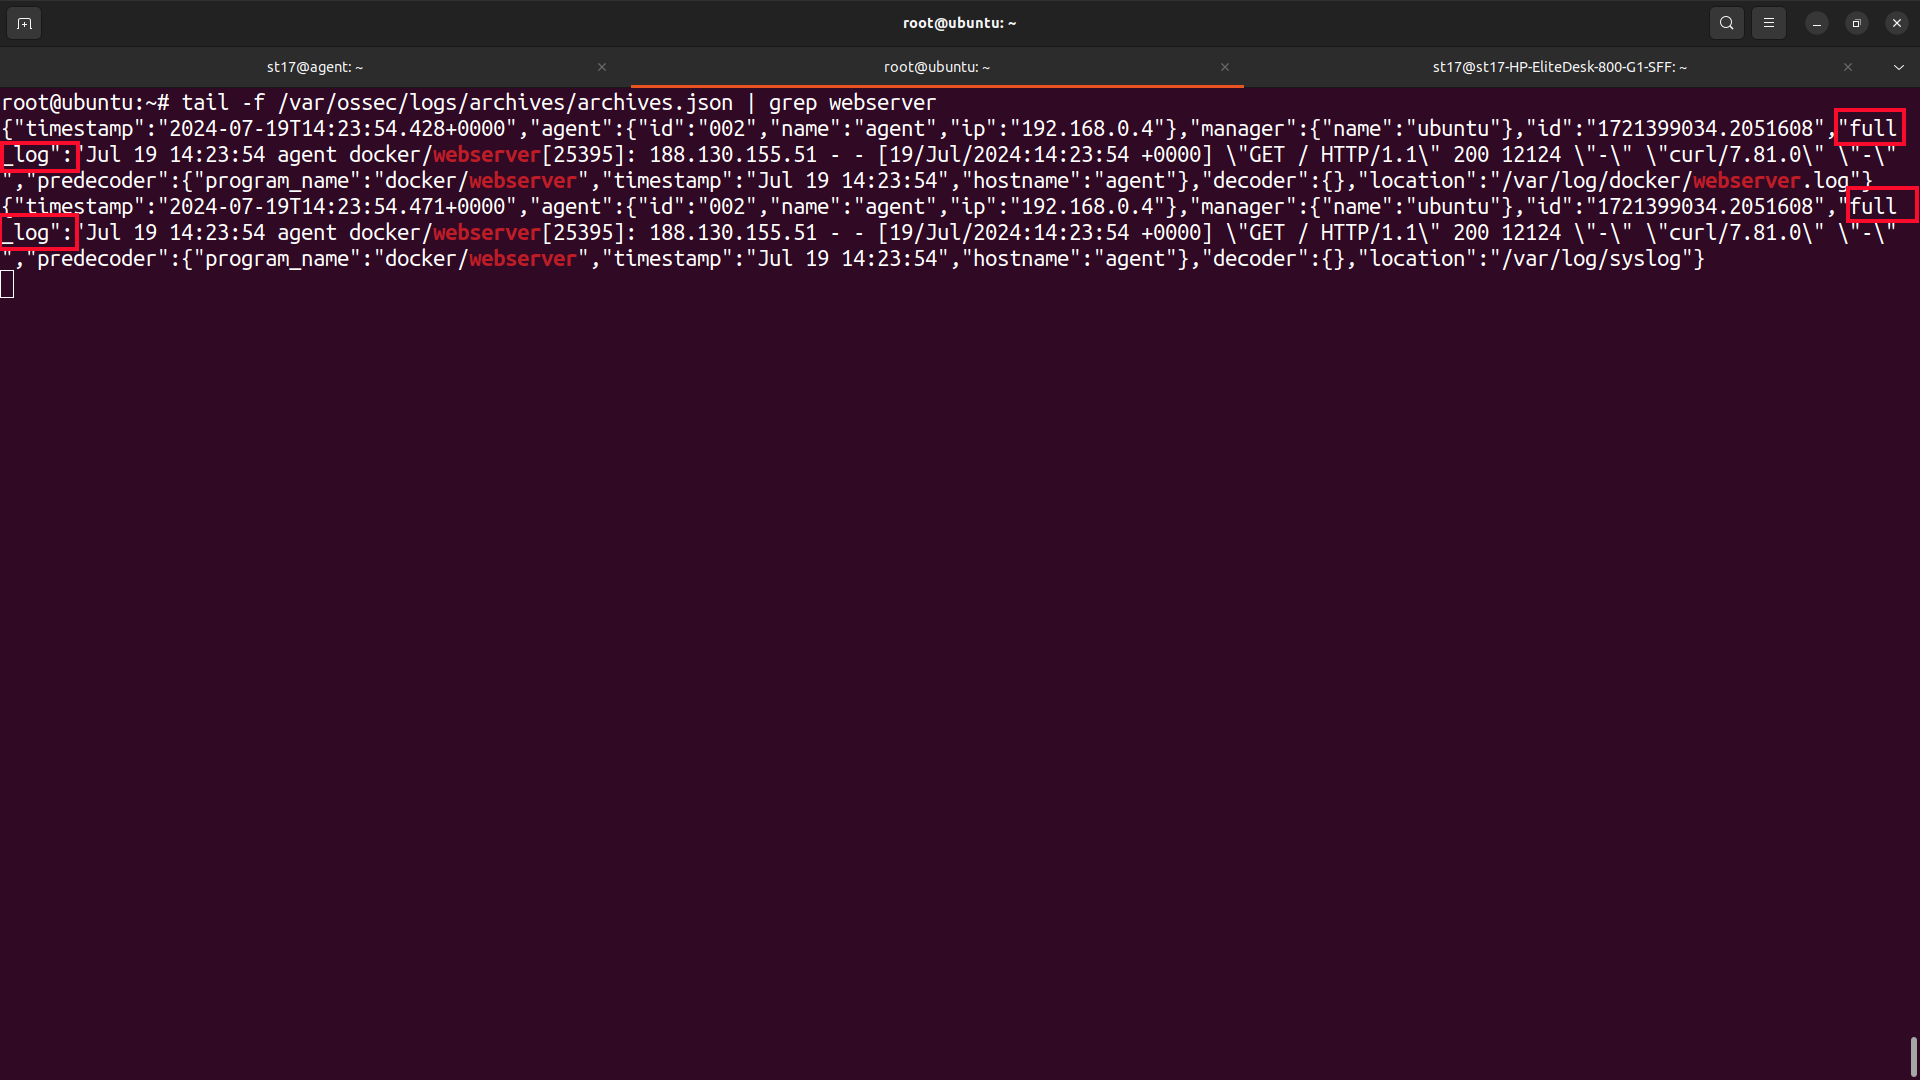
Write decoders to extract information from the full_log field. To do it, edit /var/ossec/etc/decoders/local_decoder.xml on the Wazuh manager:
<decoder name="docker_log_decoder">
  <program_name>^docker</program_name>
</decoder>

<decoder name="docker_log_decoder_2">
  <parent>docker_log_decoder</parent>
  <regex offset="after_parent">(\d*.\d*.\d*.\d*)</regex>
  <order>srcip</order>
</decoder>

<decoder name="docker_log_decoder_2">
  <parent>docker_log_decoder</parent>
  <regex offset="after_parent">(\d*/\w*/\d*)</regex>
  <order>date</order>
</decoder>

<decoder name="docker_log_decoder_2">
  <parent>docker_log_decoder</parent>
  <regex offset="after_parent">(\d*:\d*:\d*)</regex>
  <order>time</order>
</decoder>

<decoder name="docker_log_decoder_2">
  <parent>docker_log_decoder</parent>
  <regex offset="after_parent">("\w*\s/\s\w*/\d.\d"\s\d*)</regex>
  <order>web_action</order>
</decoder>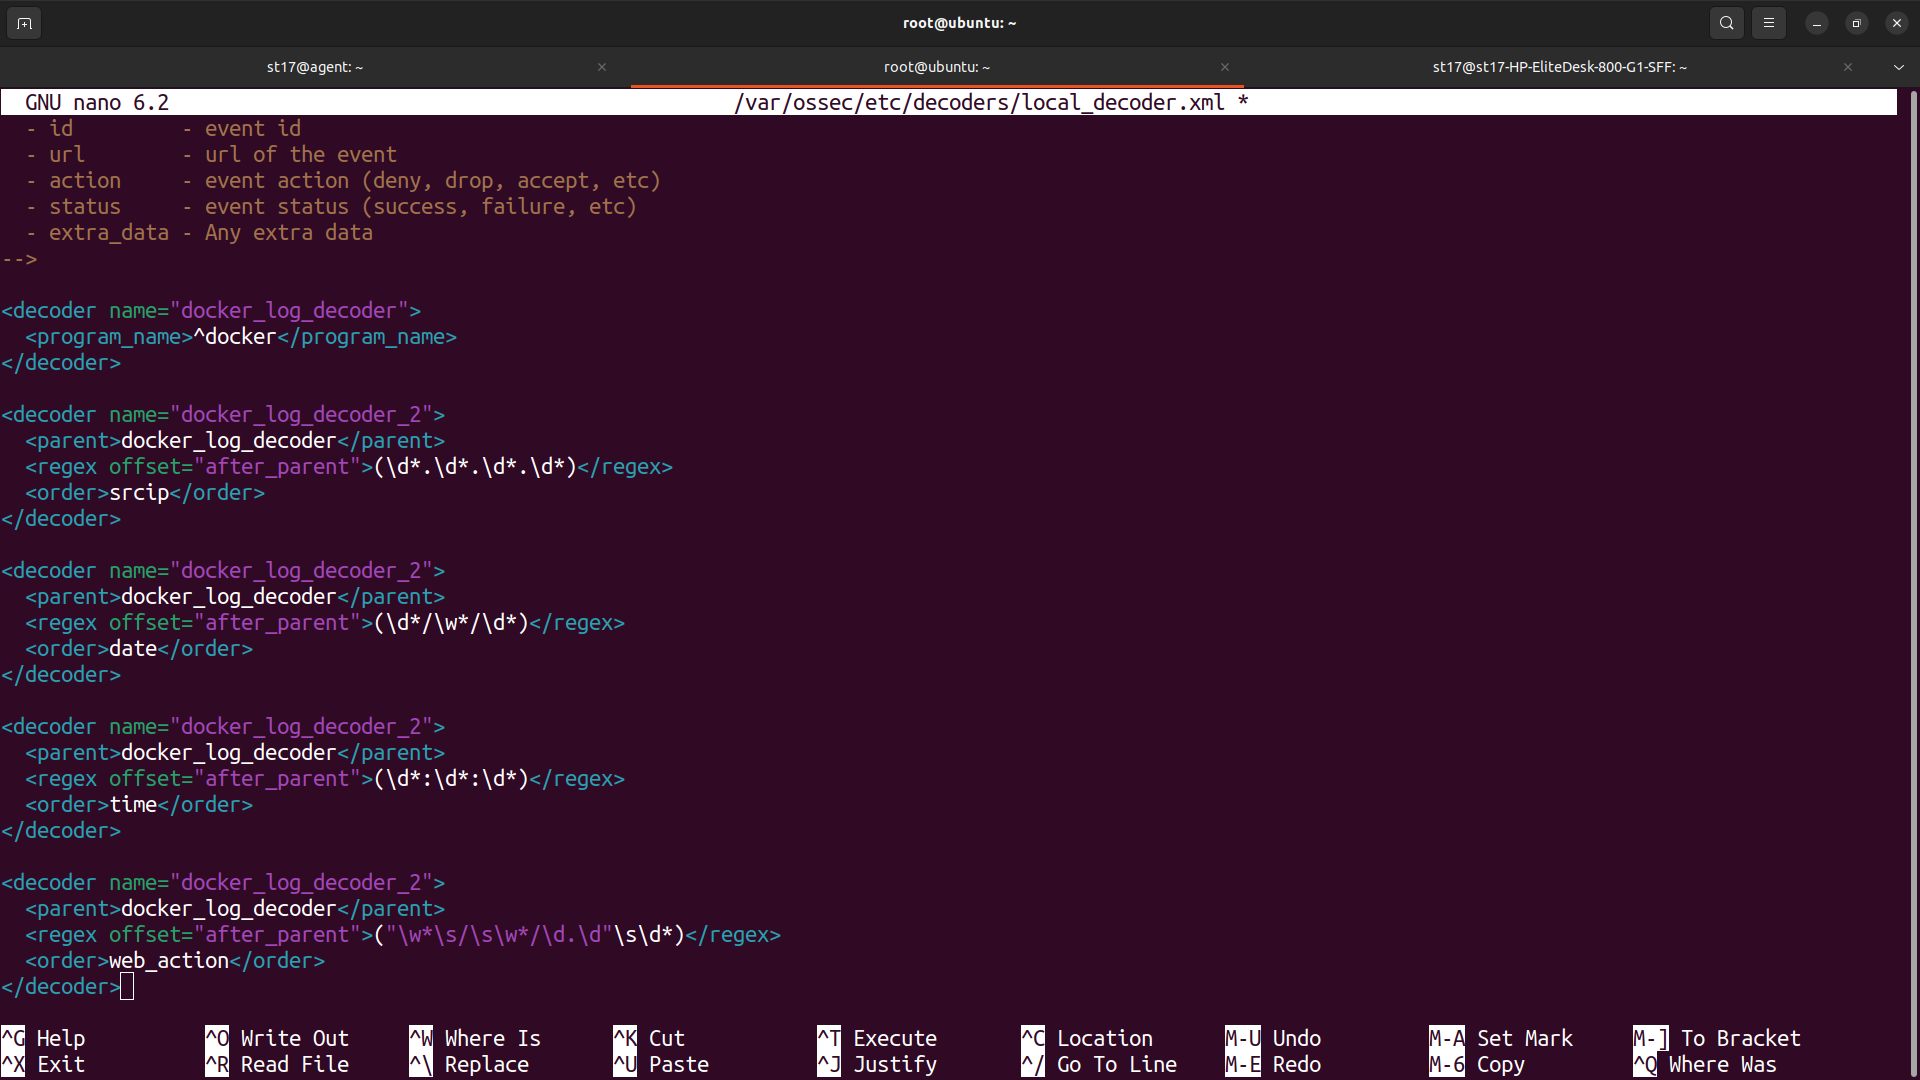
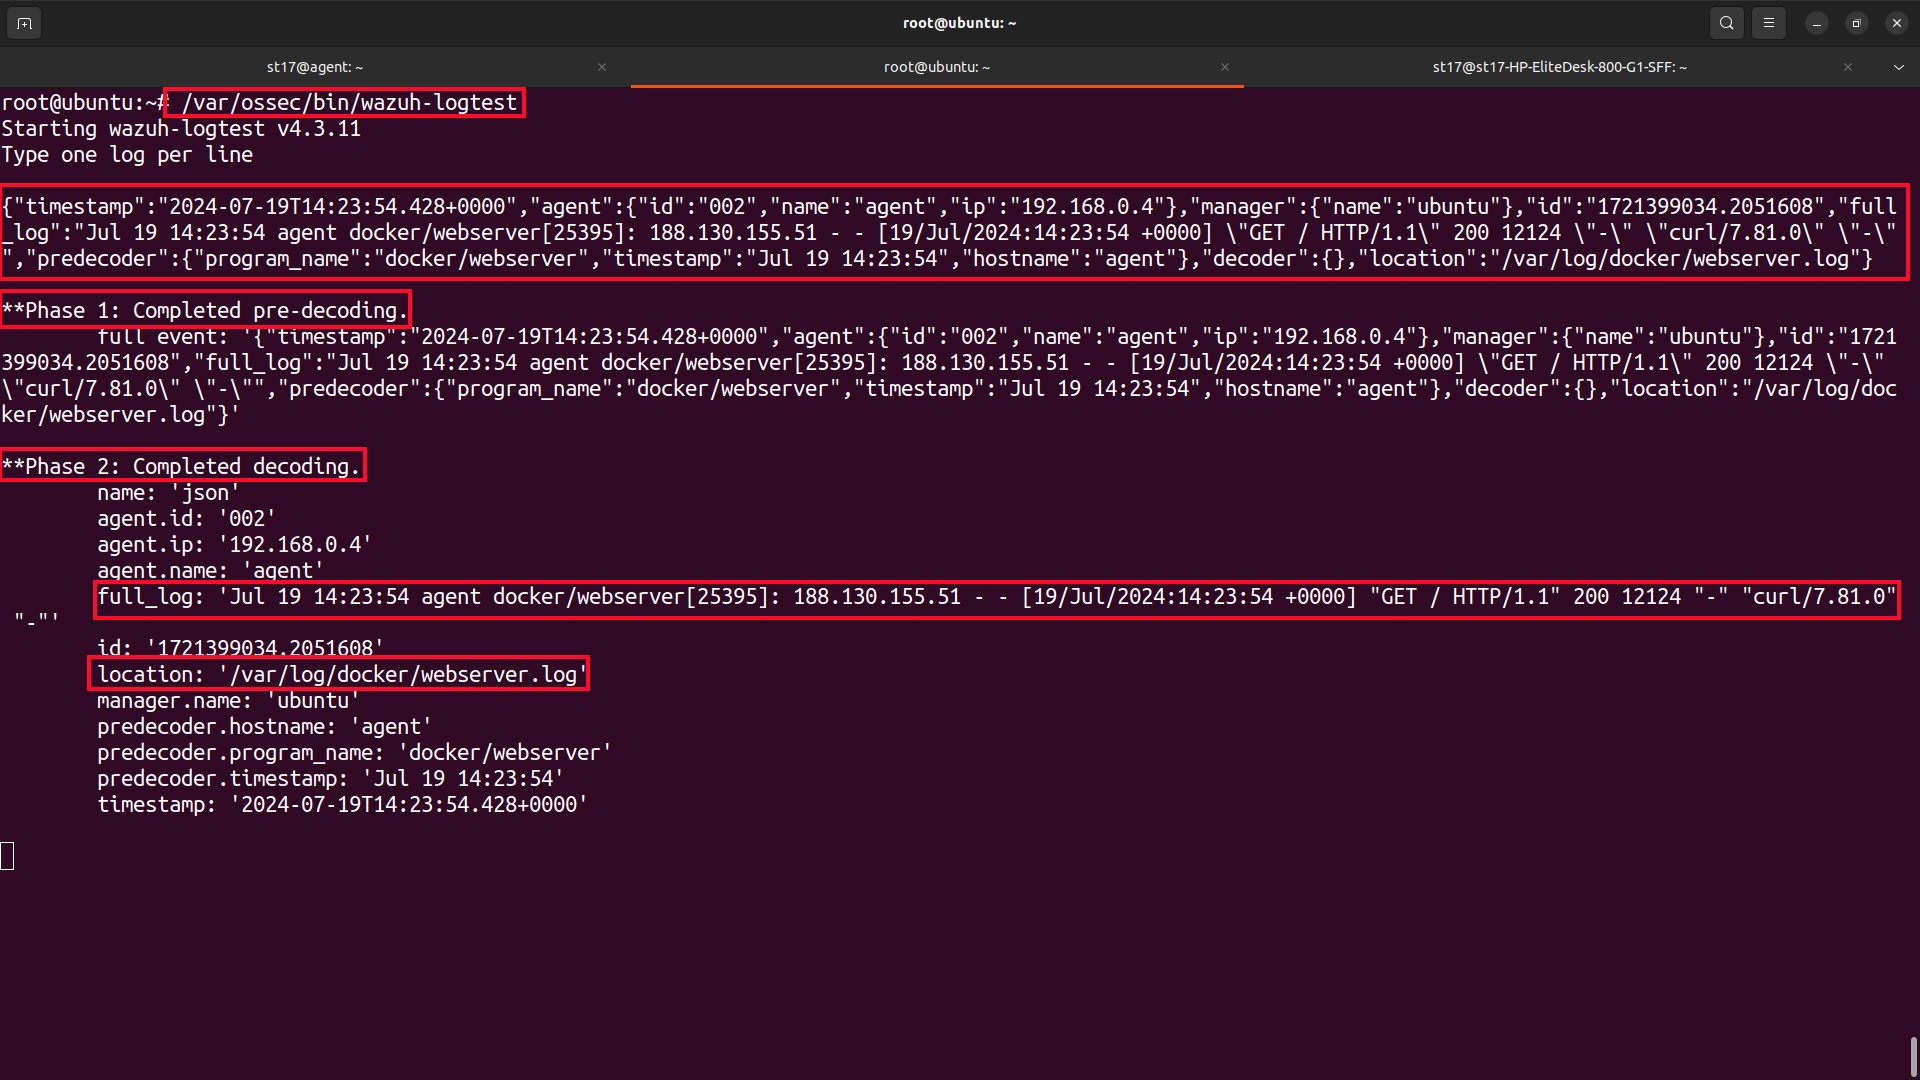
We run the log test binary to check that the decoder is extracting the event fields:
/var/ossec/bin/wazuh-logtestPaste the log after the binary starts:
To write a custom rule that triggers an alert when a GET request is made to the web server, edit /var/ossec/etc/rules/local_rules.xml on the Wazuh manager:
<group name="docker-log-rule,">
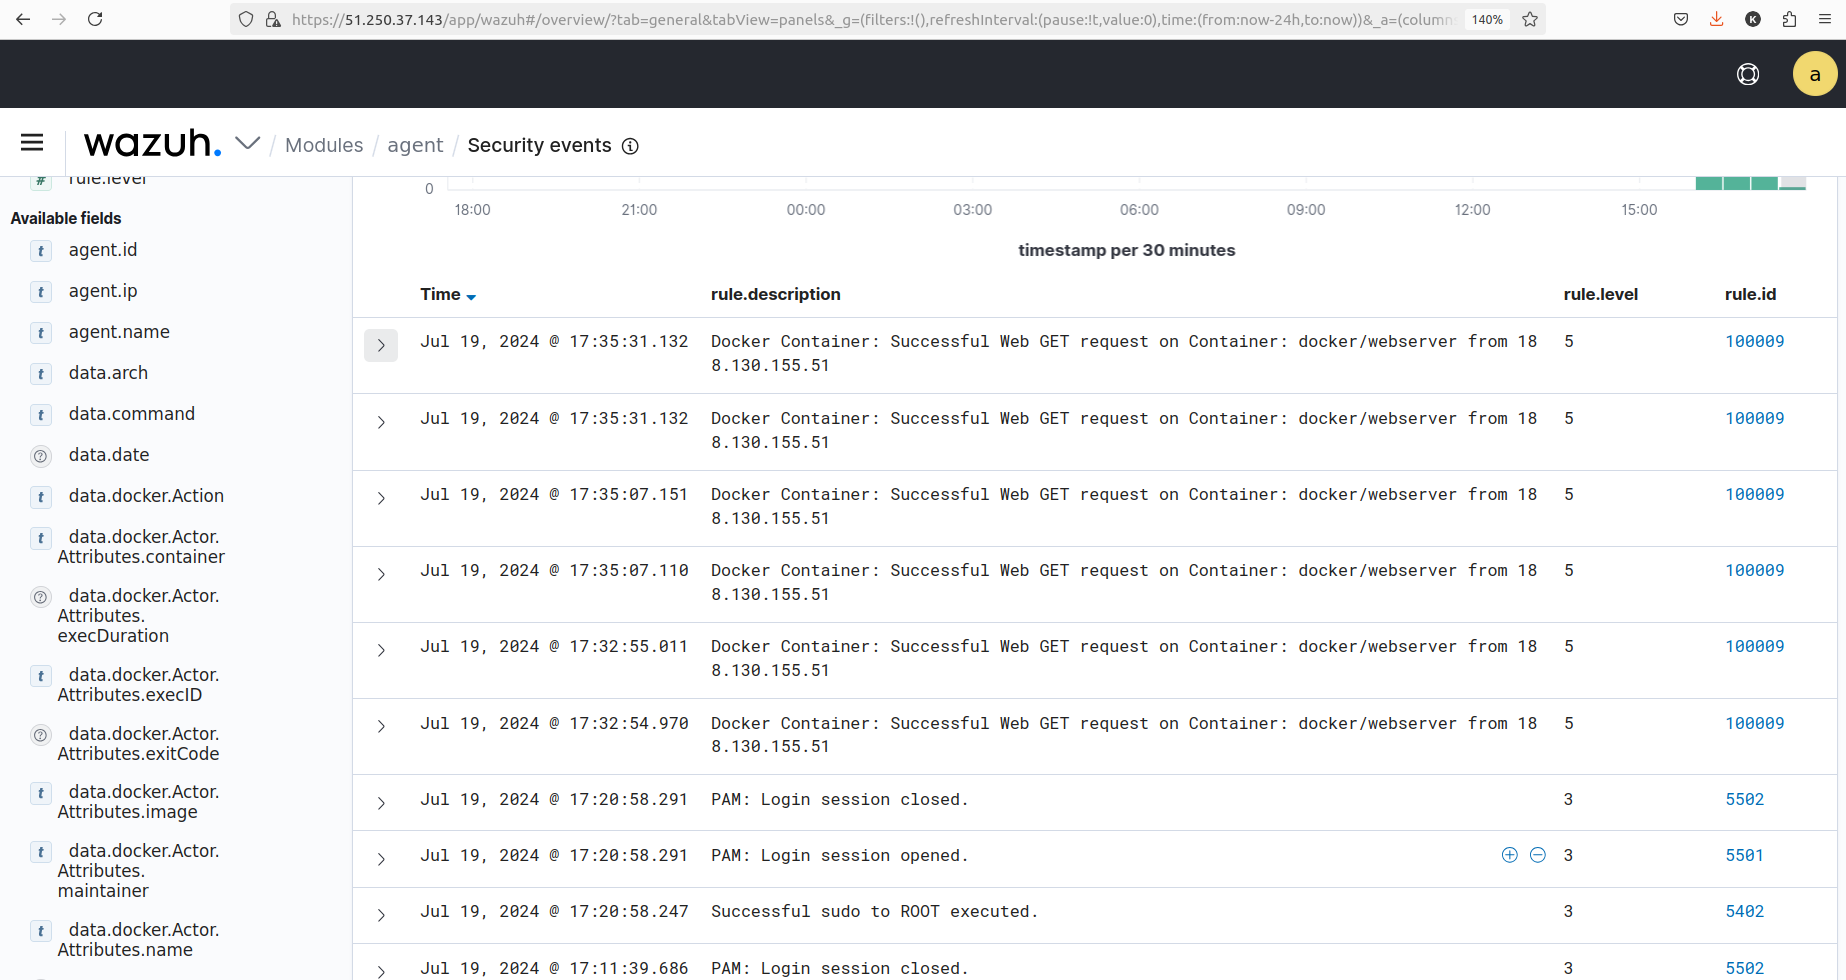
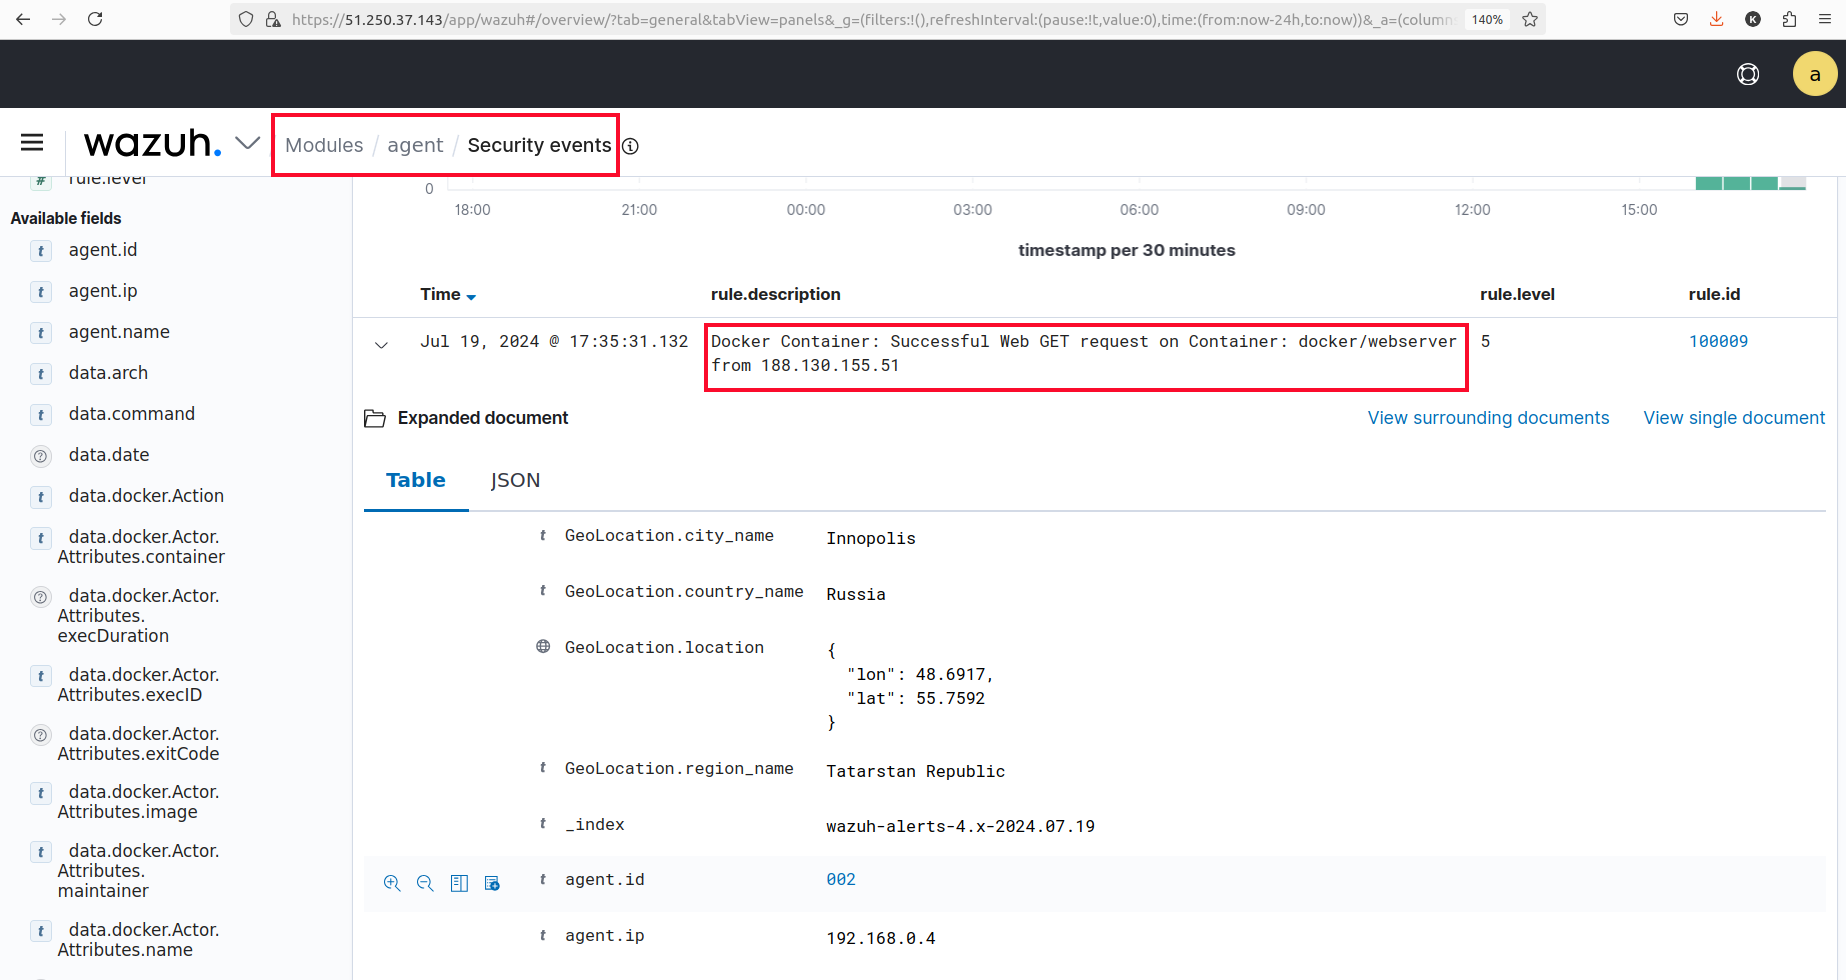
  <rule id="100009" level="5">
    <field name="web_action">"GET / HTTP/1.1" 200</field>
    <description>Docker Container: Successful Web GET request on Container: $(program_name) from $(srcip)</description> <mitre>
      <id>T1016.001</id>
    </mitre>
    <group>docker-log-rule,</group>
  </rule>
</group>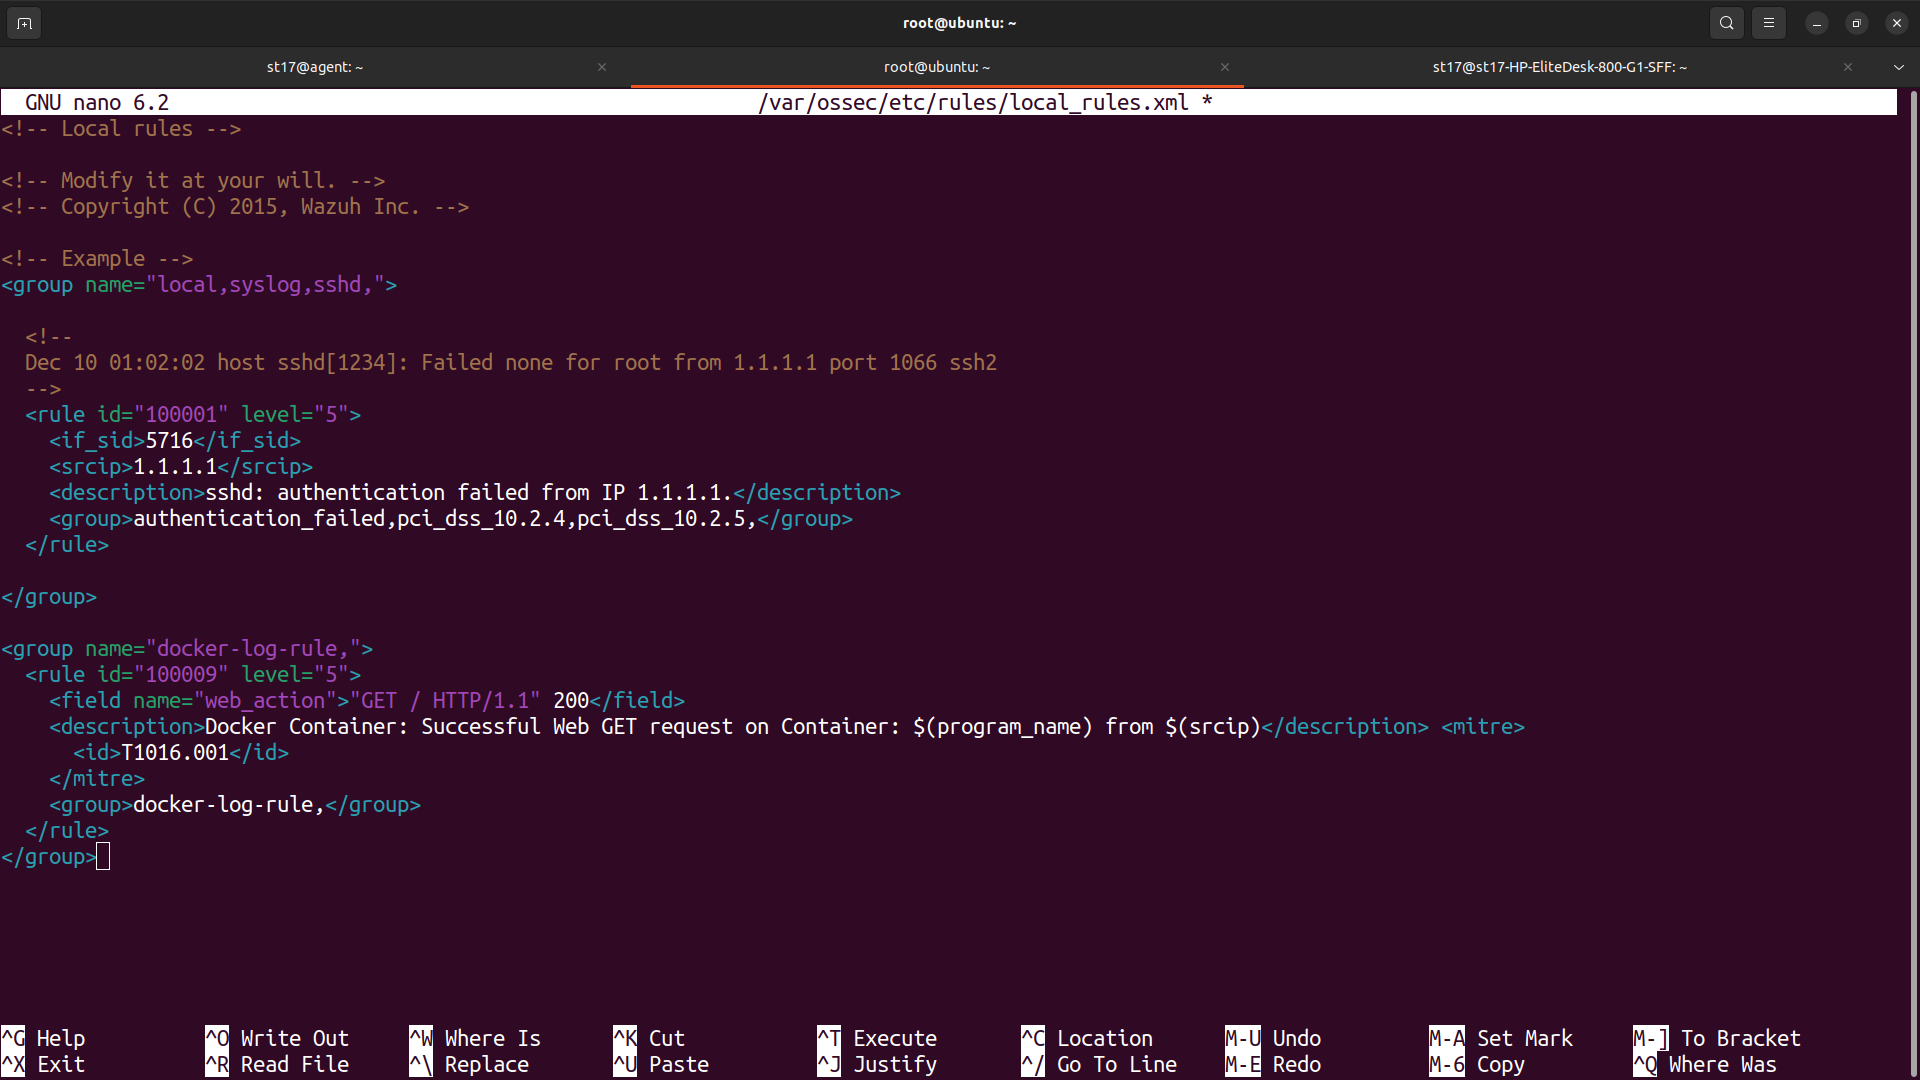
Restart the Wazuh manager for changes to apply:
systemctl restart wazuh-manager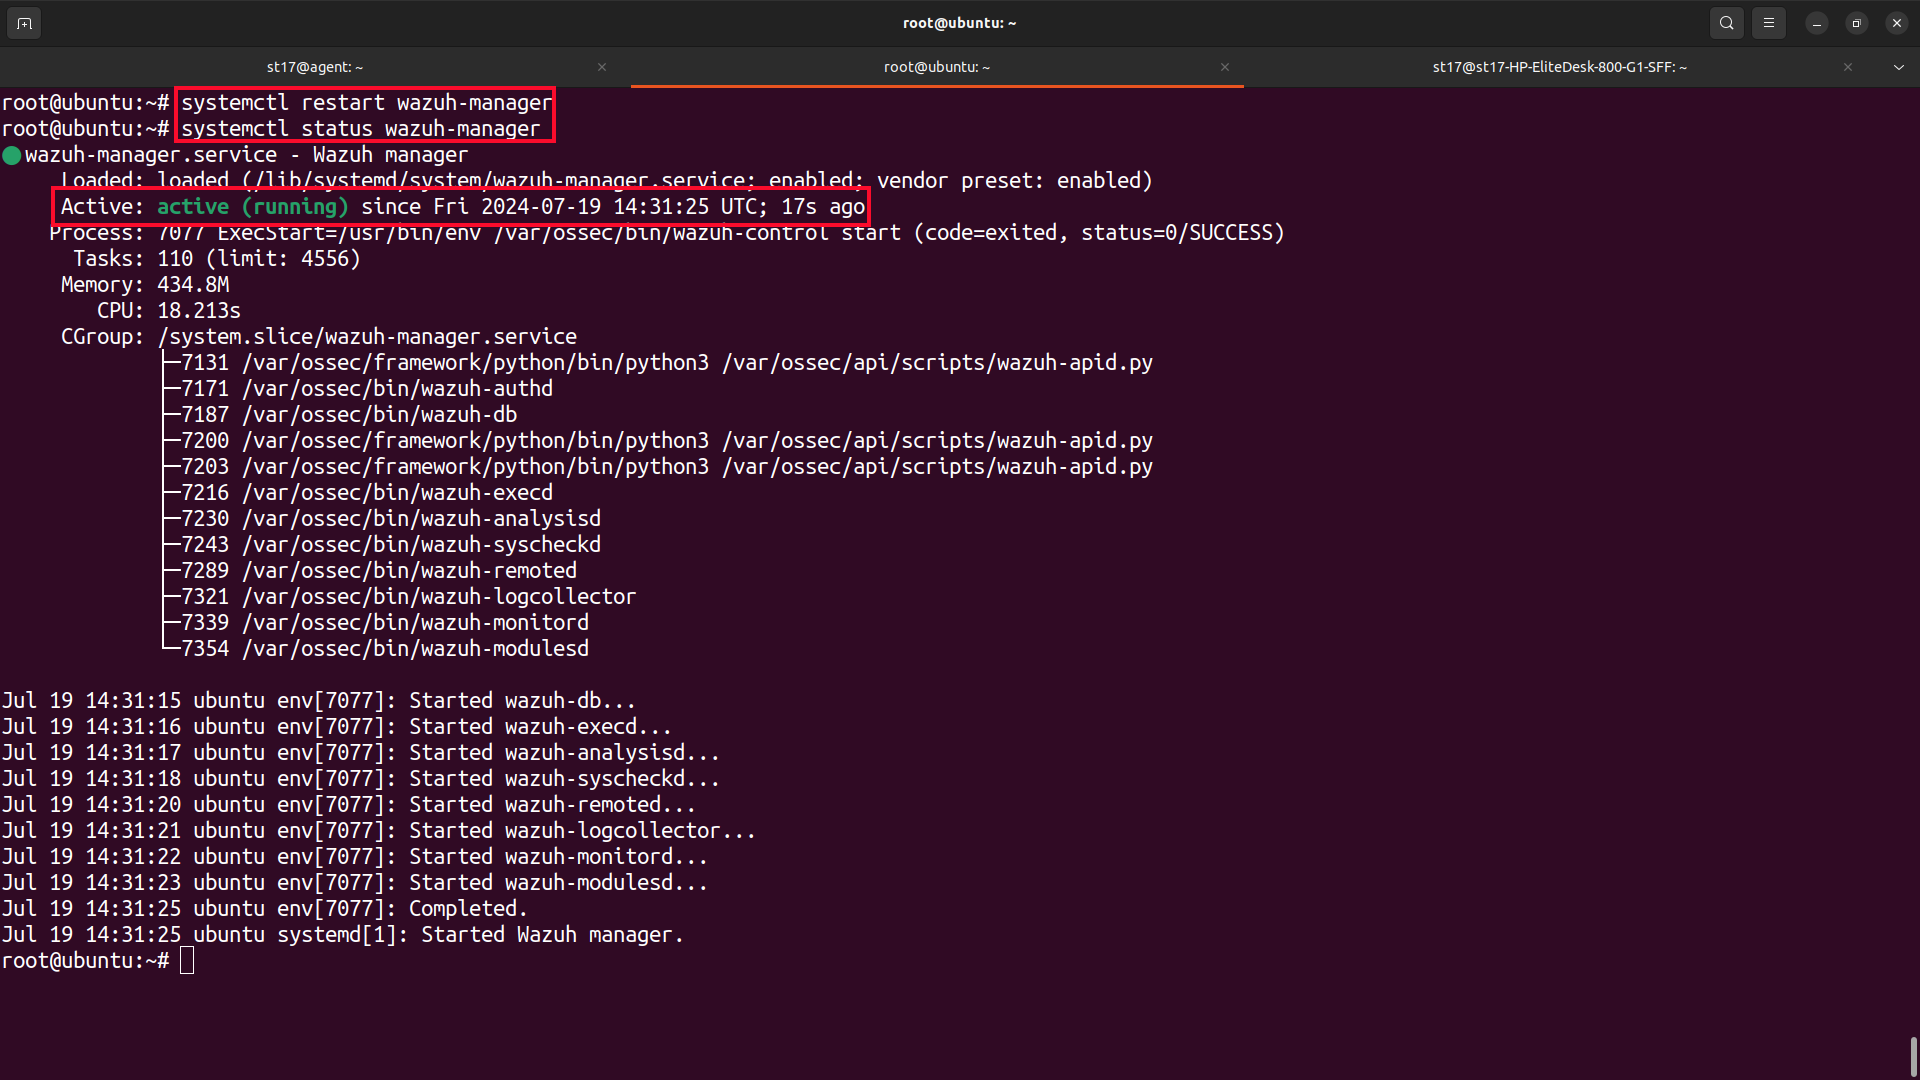
To trigger alerts for the rule that was created, do a curl request or browse to the web server container IP address. In the security events tab of the Wazuh Dashboard, we can see an example of a successful GET request alert.
3. Configuring Vulnerable Docker Engine
To effectively detect vulnerabilities in Docker Engine, particularly those that could allow an attacker to gain root access inside a container, it's important to understand the mechanics of the vulnerability and implement robust monitoring strategies. Below, we outline the steps to detect this specific vulnerability using Wazuh and other tools.
Understanding the Vulnerability
- SUID Bit Setting: The vulnerability involves setting a SUID (Set User ID) bit on
/bin/bashwithin a Docker container. This allows the binary to be executed with the privileges of the file owner (usually root), potentially giving an attacker elevated access.
- Exploitation: An attacker can execute a command from the host that accesses the compromised
/bin/bashin the container. The command./bin/bash -pcan be used to spawn a root shell.
3.1 File Integrity Monitoring (FIM) with Wazuh
Objective: Monitor the Docker container's filesystem, particularly for changes that could indicate an exploit, such as setting the SUID bit on /bin/bash.
- Monitoring Path: Use Wazuh's FIM module to monitor the path where Docker containers' filesystems are mounted. Typically, this is
/var/lib/docker/overlay2/{container_id}/merged/bin/bashor/var/lib/docker/overlay2/. Monitoring these directories can help detect unauthorized changes to the container's filesystem.
- Configuration Example:
<wazuh_config>
  <ossec_config>
    <syscheck>
	    <directories>/etc,/usr/bin,/usr/sbin</directories>
	    <directories>/bin,/sbin,/boot</directories>
	    <directories check_all="yes">/var/lib/docker/overlay2/*/merged/bin</directories>
      <frequency>3600</frequency>
      <recursive>yes</recursive>
      <check_all>yes</check_all>
      <alert_new_files>yes</alert_new_files>
      <alert_modified_files>yes</alert_modified_files>
    </syscheck>
  </ossec_config>
</wazuh_config>
This configuration checks the specified directory every hour for changes and alerts if new files are created or existing files are modified.
3.2 Audit Logging with Auditd
Objective: Capture events related to changes in file attributes and permissions, particularly the setting of the SUID bit.
- Audit Rule Example:
Add an audit rule to monitor changes to file attributes:auditctl -w /var/lib/docker/overlay2/ -p wa -k docker_fs_monitorw /var/lib/docker/overlay2/*/merged/bin: Watch the specified directory.
p wa: Monitor write and attribute changes.
k docker_fs_monitor: A custom key to identify the rule in audit logs.
- Log Collection: Ensure that audit logs are forwarded to Wazuh. This can be done by configuring the
auditdto log to a file that Wazuh monitors or by using the Wazuh agent to directly read audit logs.
3.3 Alerting and Response
- Wazuh Alerts: Configure Wazuh rules to generate alerts when specific changes are detected, such as setting the SUID bit. This involves defining rules that look for modifications in critical system binaries or unexpected changes in the Docker overlay filesystem.
- Example Rule:
In the
Wazuh ruleset, create a rule to trigger an alert when an audit event indicates a SUID bit change:<rule id="100001" level="10"> <decoded_as>auditd</decoded_as> <field name="key">docker_fs_monitor</field> <description>Possible Docker Engine vulnerability exploit detected</description> </rule>
This comprehensive setup ensures that any unauthorized changes to the Docker container filesystem, particularly those involving critical binaries like /bin/bash, are detected and alerted upon promptly. Additionally, correlating these alerts with other indicators of compromise can help identify and respond to potential security incidents more effectively.
Conclusion
In conclusion, ensuring the security of Docker environments requires proactive monitoring and vigilance. By implementing a comprehensive detection strategy using Wazuh's File Integrity Monitoring (FIM) and Auditd, you can effectively guard against Docker Engine vulnerabilities, such as unauthorized SUID bit changes. This setup provides a robust framework for detecting and alerting on potentially malicious activities, allowing for timely response and mitigation. Through careful monitoring of critical filesystem paths and auditing key events, you can significantly enhance the security posture of your Docker infrastructure, safeguarding against unauthorized access and exploitation.